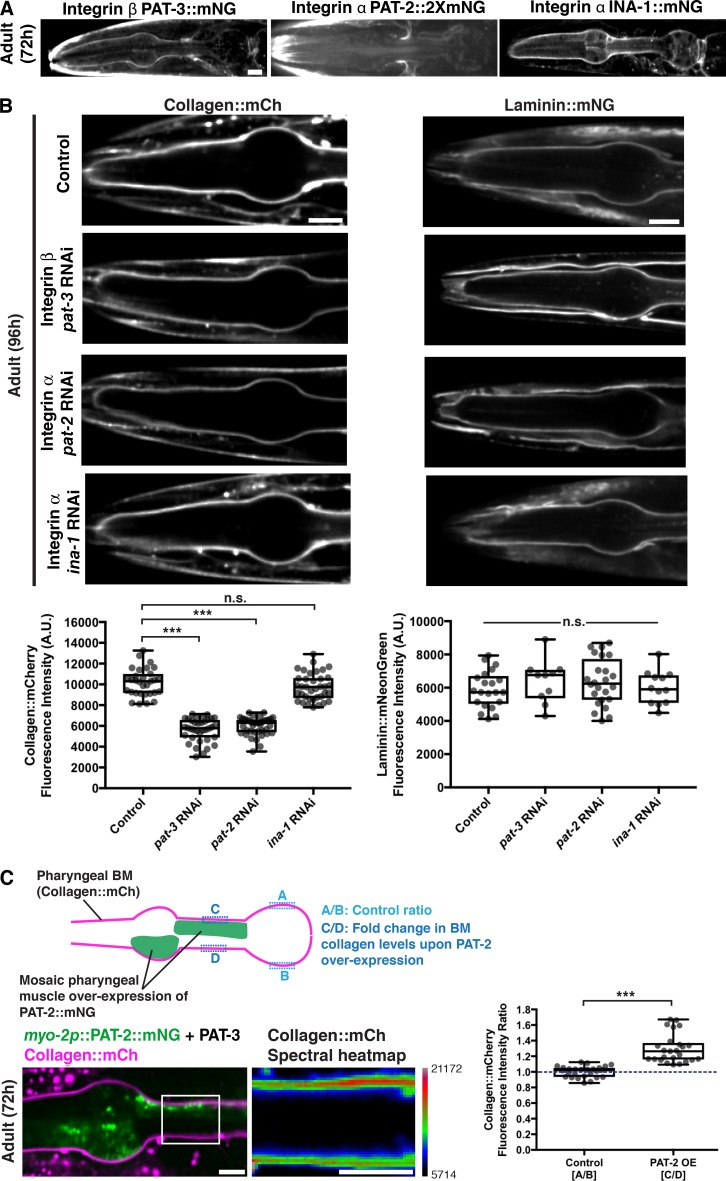
Figure 5.
The PAT-2/PAT-3 integrin heterodimer is required for laminin-independent collagen recruitment to the pharyngeal BM. (A) Fluorescence images of the integrin β subunit PAT-3::mNG and the integrin α subunits PAT-2::2xmNG and INA-1::mNG in the pharynx. (B) Fluorescence images of pharyngeal BM collagen::mCh (left) and laminin::mNG (right) in control versus pat-3, pat-2, and ina-1 RNAi-treated 96-h adult animals. Quantification of collagen::mCh (control, n = 31; pat-3 RNAi, n = 36; pat-2 RNAi, n = 39; ina-1 RNAi, n = 37) and laminin::mNG (control, n = 21; pat-3 RNAi, n = 10; pat-2 RNAi, n = 24; ina-1 RNAi, n = 12) fluorescence intensity for all treatments is shown at the bottom. Bottom left: ***, P < 0.0001, one-way ANOVA followed by post hoc Dunnett’s test; n.s. (not significant), P > 0.05. Bottom right: n.s. (not significant), P > 0.05, one-way ANOVA. (C) A schematic outlining mosaic overexpression of PAT-2::mNG in the pharyngeal muscle cells and method for quantification of collagen levels is shown on top. A merged fluorescence image of myo-2p::PAT-2::mNG (green) and collagen::mCh (magenta) in a 72-h adult pharynx is shown on the bottom left. A spectral heatmap of collagen::mCh fluorescence intensity in the boxed region is shown on the bottom right. Quantification of the fold change in pharyngeal BM collagen::mCh fluorescence intensity upon PAT-2 overexpression is shown on the right (n = 25). ***, P < 0.0001, paired two-tailed Student’s t test. Box edges in boxplots depict the 25th and 75th percentiles, the line in the box indicates the median value, and whiskers mark the minimum and maximum values. Scale bars, 10 µm. A.U., arbitrary units.

