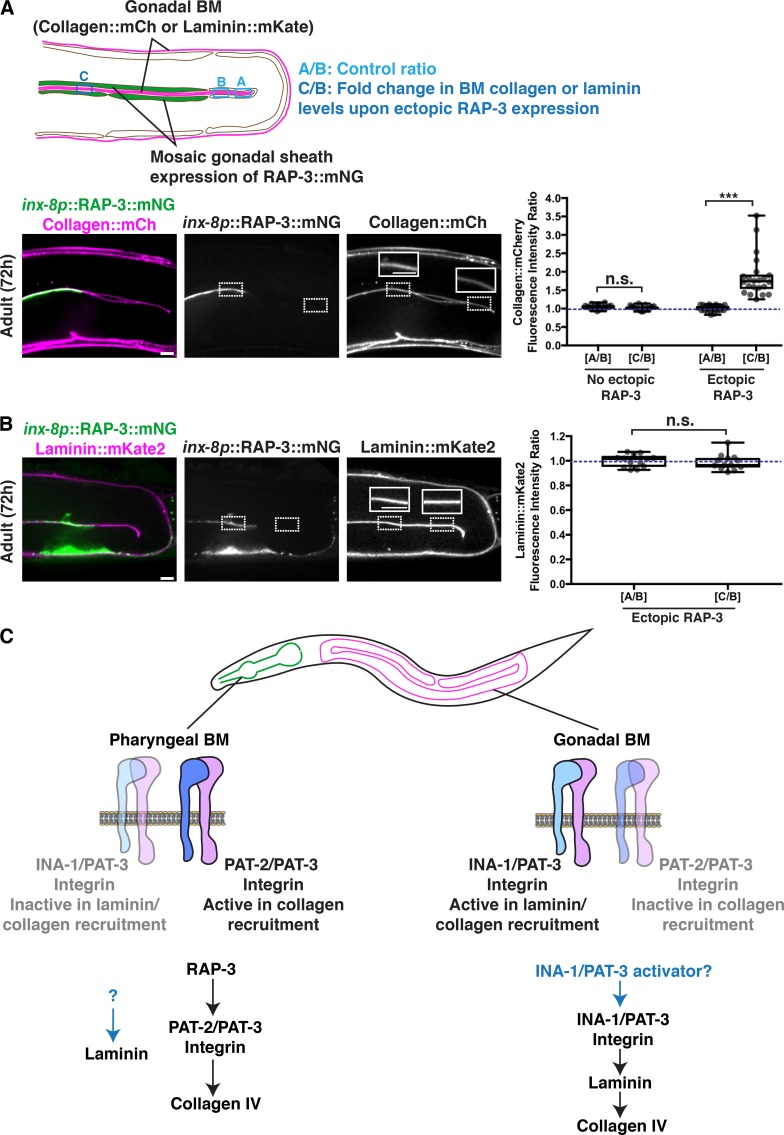
Figure 8.
Ectopic gonadal expression of RAP-3 increases BM collagen but not laminin levels. (A) A schematic outlining mosaic expression of RAP-3::mNG in the gonadal sheath cells and method for quantification of collagen and laminin levels is shown on top. A merged fluorescence image of inx-8p::RAP-3::mNG (green) and collagen::mCh (magenta) in a 72-h adult gonad is shown on the bottom left, and split RAP-3::mNG and collagen::mCh channel images are shown on the bottom right. The dotted box on the left indicates a region of RAP-3 expression, and the dotted box on the right denotes absence of RAP-3 expression. Collagen::mCh signal in the dotted box regions are magnified in insets. Quantification of fold increase in gonadal BM collagen::mCh fluorescence intensity upon ectopic RAP-3 expression is shown on the right (n = 22). (B) A merged fluorescence image of inx-8p::RAP-3::mNG (green) and laminin::mKate2 (magenta) in a 72-h adult gonad is shown on the left, and split RAP-3::mNG and laminin::mKate2 channel images on the right. The dotted box on the left indicates a region of RAP-3 expression, and the dotted box on the right denotes absence of RAP-3 expression. Laminin::mKate2 signal in the dotted box regions are magnified in insets. Quantification of fold increase in gonadal BM laminin::mKate2 fluorescence intensity upon ectopic RAP-3 expression is shown on the right (n = 13). ***, P < 0.0001, paired two-tailed Student’s t test; n.s. (not significant), P > 0.05. (C) Model for distinct modes of collagen recruitment to the pharyngeal and gonadal BMs. Box edges in boxplots depict the 25th and 75th percentiles, the line in the box indicates the median value, and whiskers mark the minimum and maximum values. Scale bars, 10 µm.

