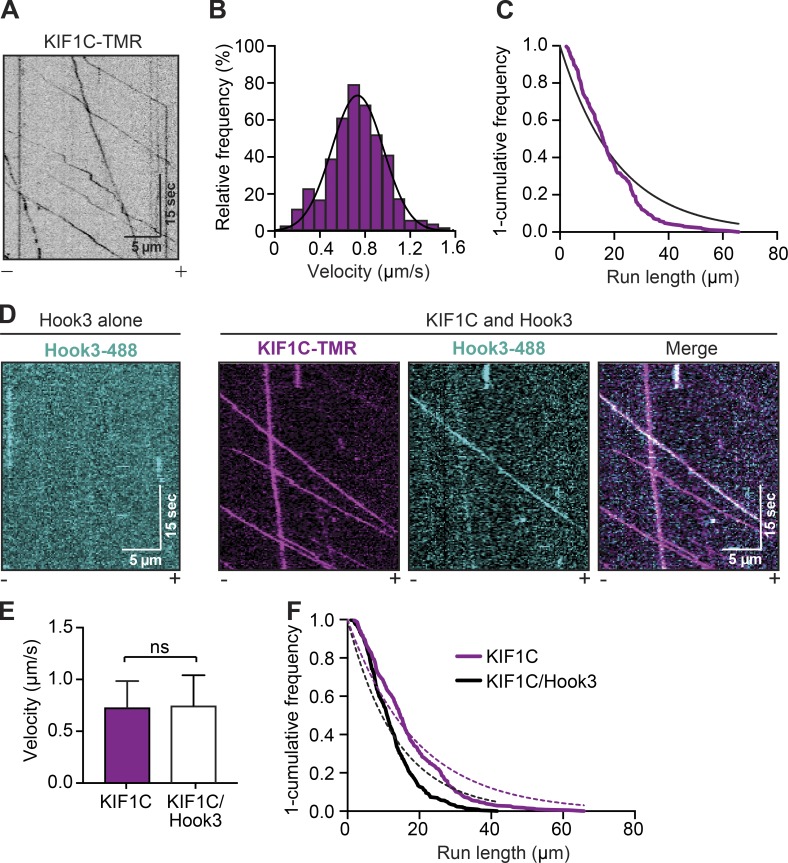
Figure 2.
KIF1C is a highly processive kinesin-3 motor whose motility is not activated by Hook3. (A) Representative kymograph from single-molecule motility assays with full-length KIF1C tagged with SNAP and 3xFLAG and labeled with TMR via the SNAP tag. Microtubule polarity is marked with minus (–) and plus (+). (B) A histogram of the velocity of single-KIF1C-TMR molecules fit to a Gaussian (black line, 0.734 ± 0.223 µm/s, mean ± SD, r2 = 0.965). Data from three independent experiments are shown (n = 433). (C) Run length analysis of KIF1C-TMR. The 1-cumulative frequency distribution was fit to a one-phase exponential decay (black line). The representative mean decay constant is 21.11 µm (r2 = 0.920, n = 158). (D) Representative kymographs from single-molecule motility assays with full-length Hook3 tagged at the amino terminus with an Alexa Fluor 488–labeled HaloTag and carboxy terminus with 3xFLAG (Hook3-488; left panel). KIF1C-TMR in the presence of Hook3-488 (right panels). Colocalized runs can be seen in the merge in white. Microtubule polarity is marked with minus (–) and plus (+). (E) Velocity (mean ± SD) of KIF1C-TMR–only runs compared with KIF1C-TMR runs in the presence of Hook3-488 (n = 433 for KIF1C only; n = 716 for KIF1C with Hook3). (F) Run length analysis from KIF1C-TMR–only runs compared with KIF1C-TMR runs in the presence of Hook3-488. The 1-cumulative frequency distribution was fit to a one-phase exponential decay (KIF1C, magenta dotted line; KIF1C with Hook3, black dotted line). The representative mean decay constant for KIF1C is 18.89 µm (r2 = 0.932, n = 385) and for KIF1C with Hook3 is 13.77 µm (r2 = 0.901, n = 418). Data were resampled with bootstrapping analysis, and statistical significance was calculated using an unpaired t test with Welch’s correction; P = 0.0485. Representative data from three independent experiments are shown.

