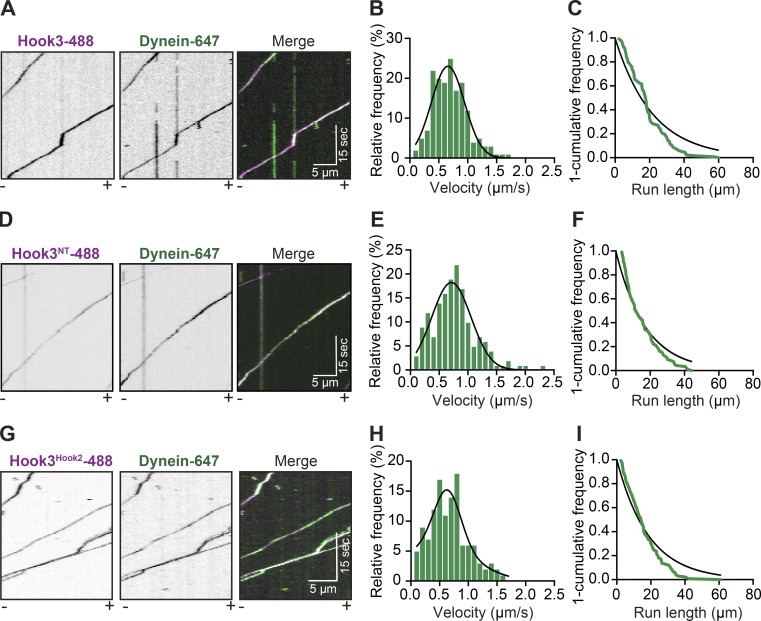
Figure 4.
Purified full-length Hook3 activates dynein motility. (A) Representative kymographs from single-molecule motility assays with purified dynein-647 (green), unlabeled dynactin, and full-length Hook3-488 (magenta). Microtubule polarity is marked with minus (–) and plus (+). (B) A histogram of dynein/dynactin velocity in the presence of purified full-length Hook3 fit to a Gaussian (black line, 0.658 ± 0.287 µm/s, mean ± SD, r2 = 0.910). Representative data from three independent experiments are shown (n = 166). (C) Run length analysis of dynein/dynactin in the presence of full-length Hook3. The 1-cumulative frequency distribution (green line) was fit to a one-phase exponential decay (black line). The representative mean decay constant is 21.65 µm (r2 = 0.902, n = 133). (D) Representative kymographs from single-molecule motility assays with purified dynein-647 (green), unlabeled dynactin, and Hook31-552-488 (magenta). Microtubule polarity is marked with minus (–) and plus (+). (E) A histogram of dynein/dynactin velocity in the presence of Hook31-552 fit to a Gaussian (black line, 0.710 ± 0.340 µm/s, mean ± SD, r2 = 0.931). Representative data from two independent experiments are shown (n = 158). (F) Run length analysis of dynein/dynactin in the presence of Hook31-552. The 1-cumulative frequency distribution (green line) was fit to a one-phase exponential decay (black line). The representative mean decay constant is 17.08 µm (r2 = 0.938, n = 118). (G) Representative kymographs from single-molecule motility assays with purified dynein-647 (green), unlabeled dynactin, and the Hook3Hook2-488 chimera (magenta). Microtubule polarity is marked with minus (–) and plus (+). (H) A histogram of velocity of dynein/dynactin in the presence of the Hook3HOOK2 chimera fit to a Gaussian (black line, 0.606 ± 0.345 µm/s, mean ± SD, r2 = 0.813). Representative data from three independent experiments are shown (n = 122). (I) Run length analysis of dynein/dynactin in the presence of the Hook3Hook2-488 chimera. The 1-cumulative frequency distribution (green line) was fit to a one-phase exponential decay (black line). The representative mean decay constant is 21.25 µm (r2 = 0.934, n = 139).

