Figure 7.
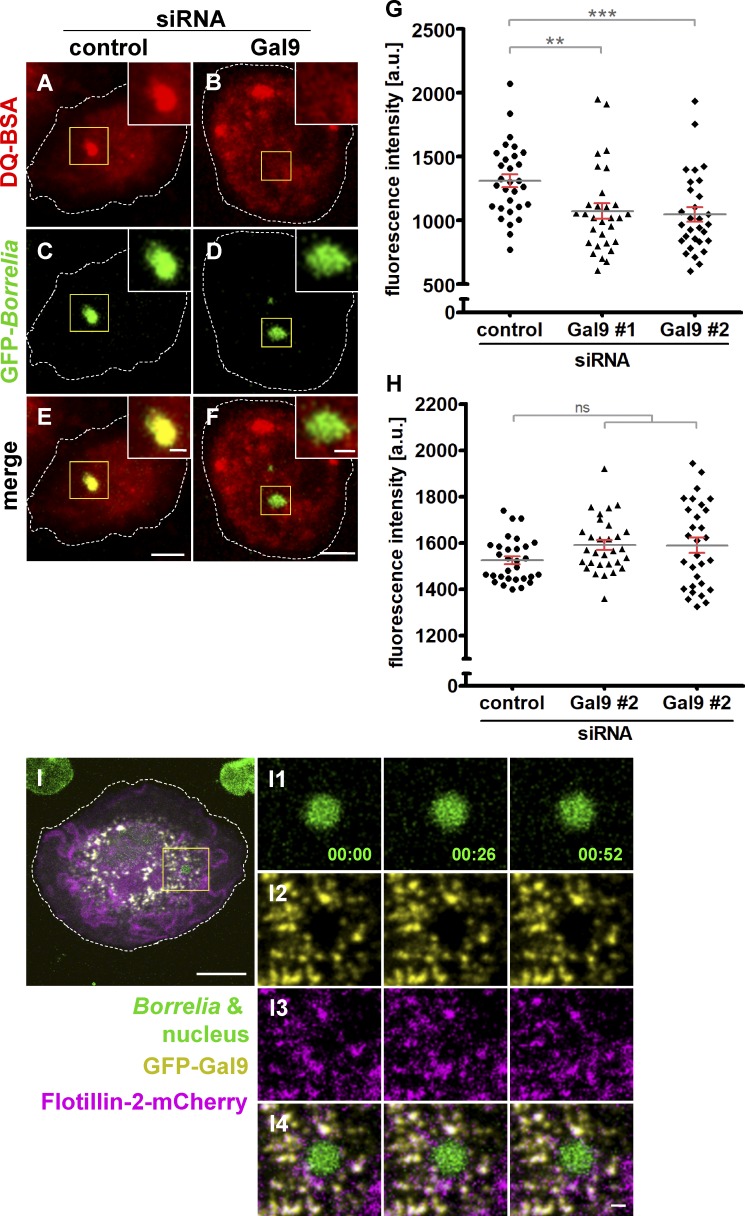
Galectin-9 regulates maturation of B. burgdorferi–containing phagosomes. (A–F) Confocal micrographs of macrophages incubated with DQ-BSA (A and B), to visualize proteolysis, with internalized GFP-expressing borreliae (C and D), with merges (E and F). Macrophages were treated with control siRNA (A, C, and E) or galectin-9–specific siRNA (B, D, and F). Scale bars: 10 µm for overview images and 1 µm for insets. (G and H) Evaluation of DQ-BSA–based fluorescence intensities at macrophage phagosomes containing borreliae (G) or overall cellular DQ-BSA fluorescence (H) Fluorescence intensities are indicated on the y axis. Macrophages were treated with control siRNA or two individual galectin-9–specific siRNAs, as indicated. n = 3, with DQ-BSA signals evaluated in 3 × 30 cells. Values are given as mean ± SEM. For specific values, see Table S1. One-way ANOVA; **, P < 0.01; ***, P < 0.001. (I) Galectin-9 dynamically colocalizes with flotillin-2 at vesicles. Still images from confocal time lapse of macrophage with an internalized B. burgdorferi cell, with the spirochete and nucleus stained by Hoechst 33342 (I1); GFP-galectin-9 shown in yellow (I2), and flotillin-2-mCherry is shown in magenta (I3), with merge (I4). Time since start of experiment is indicated in minutes:seconds. Scale bars: 10 µm, and 1 µm for insets.

