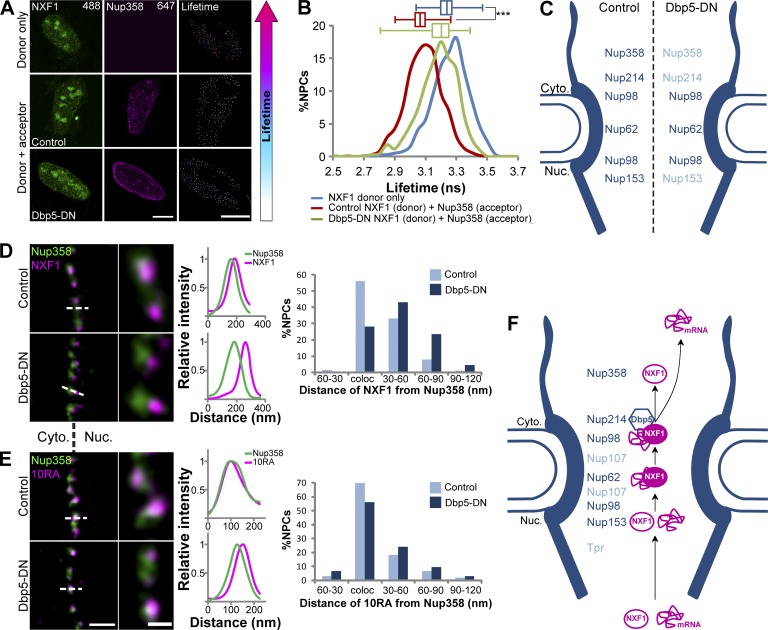
Figure 10.
Effects of Dbp5 on NXF1 interactions with the NPC. (A) FLIM-FRET analysis of NXF1 interactions with Nups in U2OS cells during an mRNA export block caused by Dbp5-DN. Since the cytoplasmic GFP-Dbp5 signal is lost during the fixation procedure, we used a nucleolar protein (GFP-NOL7) as a transfection marker (NOL7 signal was not included in the analysis; see Materials and methods and Fig. S5). Cells transfected with GFP-NOL7 only (control) or GFP-Dbp5-DN along with GFP-NOL7 (10:1 ratio) were immunostained with either donor-only (anti-NXF1) or donor + acceptor (anti-NXF1 + anti-Nup358) primary antibodies and with two secondary antibodies (Alexa Fluor 488 as donor and Alexa Fluor 647 as acceptor). Analysis was made only on single NPCs detected by Imaris. Detected NPCs were pseudocolored according to the donors’ LT values. Right-hand boxes show the enlarged nucleus area. Scale bar, 10 µm. (B) Histogram showing the LT values of the NXF1-donor in single NPCs in donor-only cells (blue, n = 1,694 NPCs, 6 cells) compared with donor + acceptor control cells (red, n = 1,328 NPCs, 6 cells) and donor + acceptor cells expressing Dbp5-DN (green, n = 786 NPCs, 3 cells). ***, P < 0.001. Box plots show the LT values (center line, median; box limits, upper and lower quartiles; whiskers, minimum to maximum range). (C) Summary of the FLIM-FRET measurements between NXF1 and indicated Nups in control and Dbp5-DN–expressing cells. Dark blue indicates Nups found to interact with NXF1, and light blue indicates loss of interaction due to Dbp5-DN. (D and E) Example for analysis of the distance frequencies between NXF1 (D) or NXF1-10RA (E) and Nup358 signals (script Nup_dis in the online supplemental material). Left: STED images showing the localization of NXF1 relative to Nup358 in control (top) and Dbp5-DN–expressing cells (bottom). An enlarged area is shown on the right. Measured distances (dashed line) were plotted in a histogram (right). See Materials and methods for the number of NPCs and cells shown. Measurements were performed in three independent experiments. Scale bars, 0.3 µm (left) and 0.1 µm (right). (F) Suggested model illustrating the interactions among the mRNA, NXF1, and NPC during mRNA export, as described in the Discussion.

