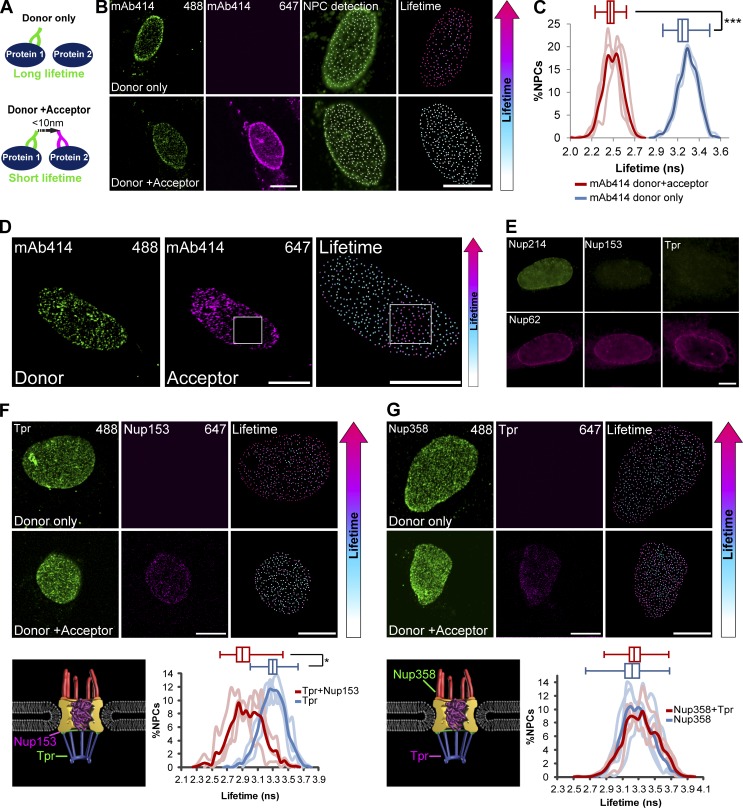
Figure 3.
Detecting interactions within single NPCs using FLIM-FRET. (A) Scheme describing a FLIM-FRET experiment. A pair of proteins is immunostained with either one (donor only) or two primary antibodies (donor + acceptor) and two secondary antibodies (Alexa Fluor 488 as the donor fluorophore and Alexa Fluor 647 as the acceptor). If the distance between the proteins is <10 nm, then FRET occurs and the LT of the donor shortens. (B) NPCs were immunostained using mAb414. Cells were either stained with one secondary antibody (donor only, Alexa Fluor 488) or two secondary antibodies (donor + acceptor, Alexa Fluor 488 and Alexa Fluor 647). Single NPCs were detected using Imaris, and the lifetime values for the pixels of each individual NPC were measured. All detected NPCs were pseudo-colored according to the donor’s LT values. Right-hand boxes show an enlarged image of the nucleus. (C) Histograms showing the LT values of the mAb414-donor in single NPCs in donor-only cells (blue; n = 907 NPCs, 3 cells) compared with donor + acceptor cells (red; n = 1,179 NPCs, 4 cells) in one representative experiment. Light lines represent data from single cells, and the bold plot contains data from all cells. Box plots of the LT values show the reduction in the lifetimes when the acceptor is introduced (center line, median; box limits, upper and lower quartiles; whiskers, minimum to maximum range). ***, P < 0.001. FLIM-FRET measurements were performed in three independent experiments. ns, nanoseconds. (D) Control acceptor-bleach experiment. Mab414 labeled NPCs were stained with two secondary antibodies. The acceptor was photobleached in the marked area (box), and the LT was measured in all NPCs. There was no FRET in the bleached region. (E) Antibodies can penetrate into the NPC from the cytoplasmic side. Cells were permeabilized with digitonin. Nup214 and Nup62 inside the NPC were stained, but nuclear basket Nups Nup153 and Tpr were not. (F and G) Immunostaining and LT analysis of (F) Tpr (donor) along with Nup153 (acceptor) or (G) Nup358 (donor) along with Tpr (acceptor). Detected NPCs were pseudocolored according to the donor’s LT values, and analysis is as in C above. Right-hand boxes show an enlarged image of the nucleus. The histogram shows the LT values of donor cells (blue) compared with donor plus acceptor cells (red). Light lines represent data from single cells, and the bold plot contains data from all cells. See Materials and methods for the number of NPCs and cells shown. *, P < 0.05. Scale bars, 10 µm.

