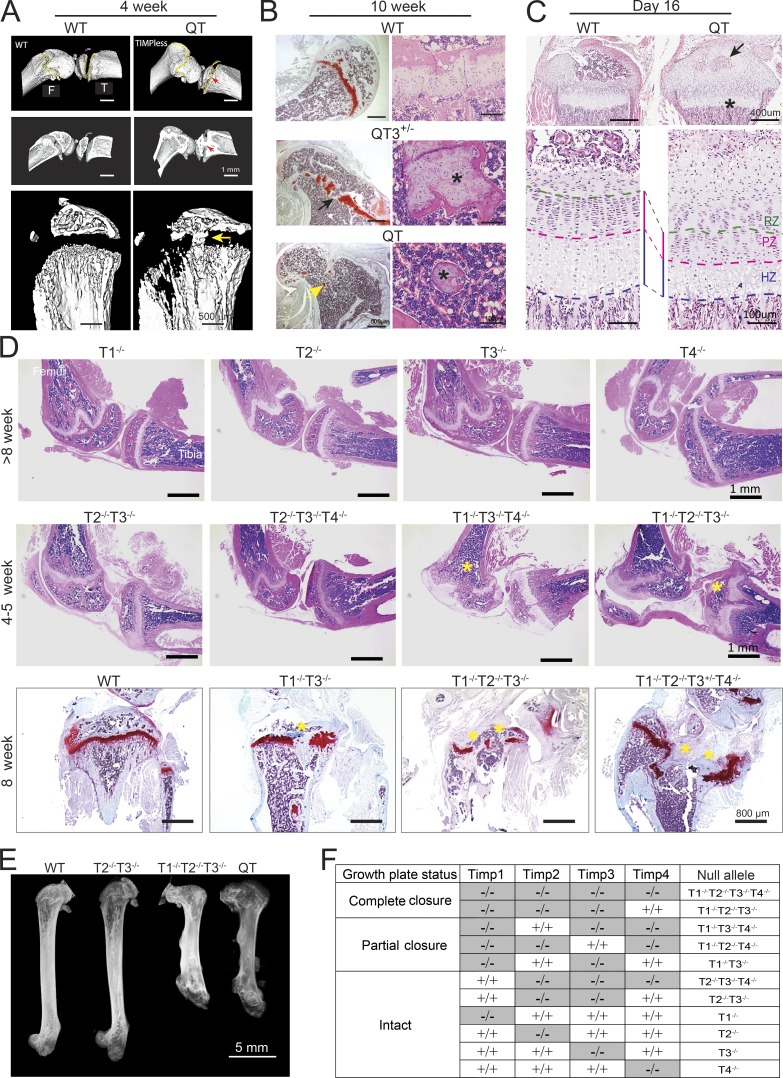
Figure 3.
Growth plate closure in different combination of TIMP knockouts. (A) Micro-CT images of 4-wk-old WT and QT knee joint. QT mice exhibit growth plate closure in the tibia and femur (upper and middle panels; cross section view; red arrow). High-resolution micro-CT images demonstrating growth plate closure in QT tibiae (yellow arrow; lower panel). (B) Femurs stained with H&E (right panel) and safranin-O (left panel) from 10-wk-old mice. WT mice retain an intact growth plate; QT3+/− cartilage is bridged by bone in several locations (black arrow), and only small islands of bone-encased cartilage remain in QT3+/− and QT bone (yellow arrow), as shown at higher magnification (*) on right panel. (C) H&E-stained tibiae of 16-d WT and QT mice. Upper panels indicate impaired secondary ossification center (arrow) and flattened growth plate (*) in QT tibia. Enlarged view in lower panels indicates that QT tibia has thinner hypertrophic zone (HZ) and proliferating zone (PZ). RZ, resting zone. (D) H&E-stained knee joints of different TIMP knockout combinations. Upper panels display knee joints of individual TIMP knockouts. Middle panels depict different levels of growth plate closure (*) of multiple-TIMP knockouts. Safranin O–stained tibiae of 8-wk-old WT and multiple TIMP knockouts (lower panels) exhibit growth plate closure (*; 4×/0.5-NA objective). (E) Faxitron x-ray image of femur, demonstrating the lengths of WT and different multiple TIMP knockouts (8-wk-old). (F) Summary of TIMP knockout combinations that result in growth plate closure or have an intact growth plate.

