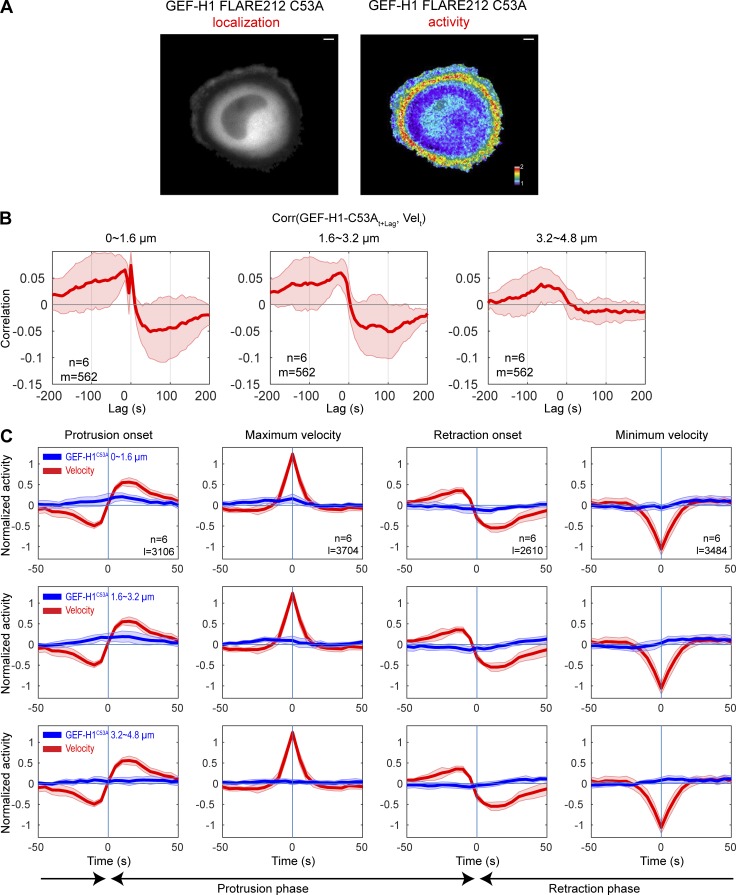
Figure 4.
GEF-H1 FLARE212 C35A shows shifted temporal coordination with edge motion. (A) Representative localization and activity maps of GEF-H1 FLARE212 C35A biosensor in migrating cells. Scale bar = 10 µm. (B) Averaged correlation curves between GEF-H1 FLARE212 C35A signal and edge velocity. The number of windows sampled (m) and total cells analyzed (n) are indicated. (C) Fluctuation of GEF-H1 FLARE212 C35A signal around edge motion events. Fluctuation curves from different cells (n = 6) are averaged (solid lines), and shaded confidence bands indicate ±2 × SEM. The total number of analyzed edge motion events (l) is indicated.

