Figure 5.
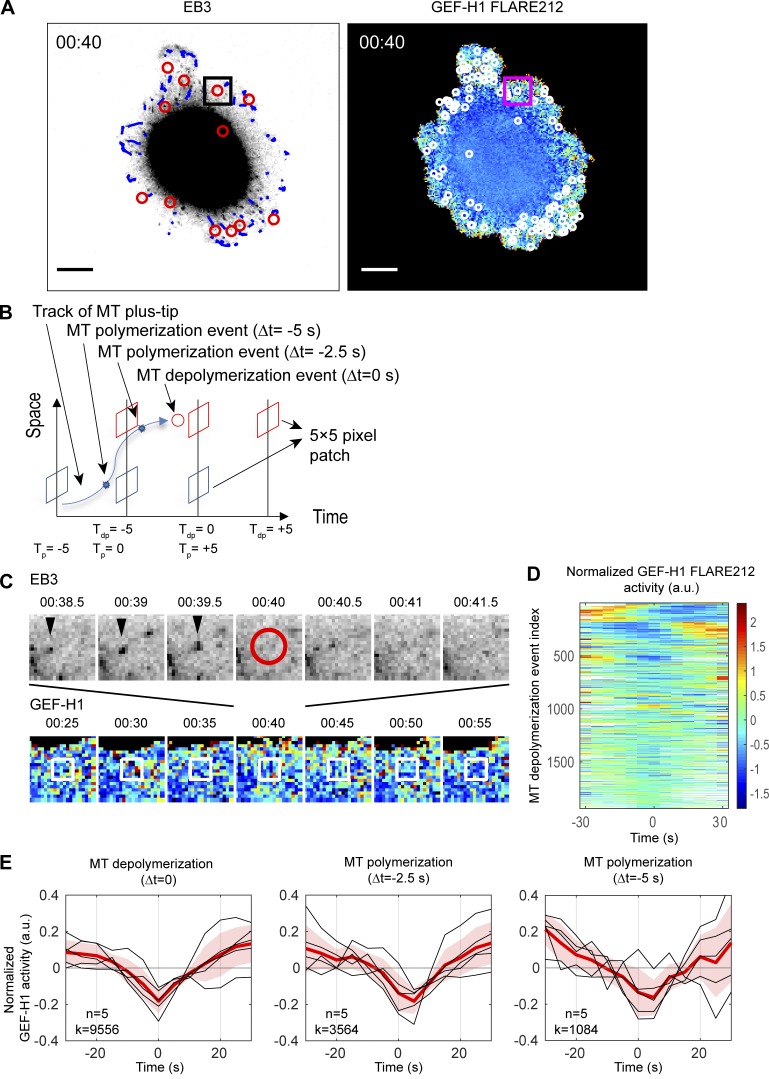
Local GEF-H1 activity is affected by MT dynamics. (A) Imaging of a MDA-MB-231 cell coexpressing mRuby-EB3 and GEF-H1 FLARE212. Right panel shows MT depolymerization events (red circles) and computationally tracked MT plus-tips (blue) over a 500-ms interval. Left panel shows MT depolymerization events (white circles) accumulated over a 5-s interval and mapped on the activity map of GEF-H1 FLARE212. Scale bar = 10 µm. (B) Schematic of GEF-H1 activity sampling before and after MT depolymerization (red) and polymerization (blue) events. Tdp = 0 (Tp = 0) denotes the time of MT depolymerization (polymerization) registered to the nearest GEF-H1 imaging frame. (C) Seven consecutive images of EB3 (top row) and GEF-H1 activity (bottom row) within the square area indicated in A to demonstrate sampling of local GEF-H1 activities around an MT depolymerization event shown in the center at 00:40 (red circle). White boxes indicate the fixed area around the MT depolymerization event over which GEF-H1 activity time courses are sampled. (D) Time courses of normalized local GEF-H1 activities aligned to the time of MT depolymerization (Tdp = 0) sampled from the cell shown in A. The time courses are ordered using hierarchical clustering for visualization purposes. White regions indicate values that cannot be calculated because an MT depolymerization event is near the beginning or the end of the imaging series. (E) Typical fluctuations of normalized local GEF-H1 activity 30 s before and after MT depolymerization (left) and polymerization (middle and right, at 2.5 or 5.0 s before MT shrinkage). For each plot, the per-cell average (red) of the local GEF-H1 activity time courses (n = 5, black) are taken, and the cell-to-cell variability is shown by ±2 × SEM (shaded bands). The total number (k) of MT (de)polymerization events at Δt = 0, −2.5, or −5 s detected from n = 5 cells is indicated.

