Figure 6.
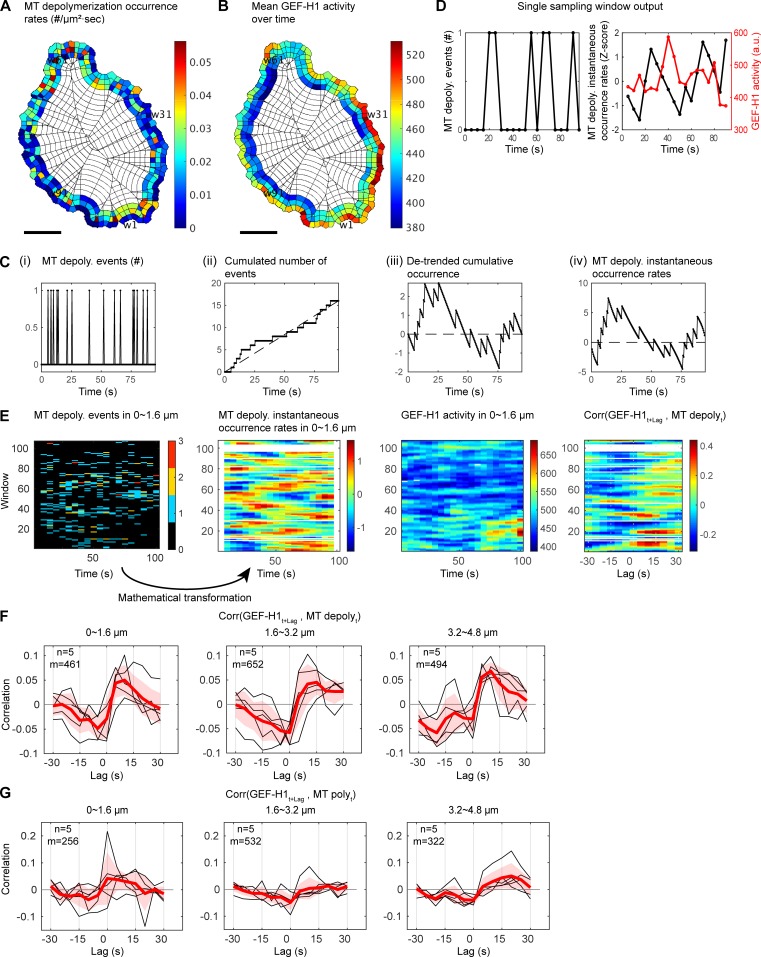
GEF-H1 activity is temporally correlated with spontaneous MT polymerization/depolymerization events. (A and B) Spatial distributions of MT depolymerization event occurrence rates (n/µm2 · s; A) and GEF-H1 FLARE212 activity (B), shown as the temporal average in each sampling window. Scale bar = 10 µm. (C) Mathematical transformation of sparse event time series into instantaneous occurrence rate time series. (Ci) A serially observed number of MT depolymerization events within a small sampling window over 190 frames (0.5 s/frame). (Cii) Time series of cumulative events displays a linear trend, which is characteristic for a Poisson point process. (Ciii) To measure cofluctuation of discrete events with another continuous signal, the cumulative events time series is detrended. (Civ) The detrended signal has a time-dependent variance (larger in the middle and smaller at the beginning and ending of the observation period). The time-varying factor in the variance is normalized to obtain a time series that is suitable for cross-correlation analysis. The transformed signal is interpreted as an excess instantaneous occurrence rate time series (see Materials and methods for details). (D) Time courses of MT depolymerization occurrence within every 5-s time interval in one sampling window (left) and its instantaneous occurrence rate (black) and GEF-H1 activity (red) recorded in the same window (right). (E) Activity maps for the number of MT depolymerization events, their instantaneous occurrence rates, and GEF-H1 activities (from left to right) recorded over time in sampling windows ~0–1.6 µm from the cell edge. The right panel shows in each sampling window the cross-correlation between the GEF-H1 activity and the MT depolymerization occurrence rate. (F) Cross-correlations between the instantaneous occurrence rate of MT depolymerization and the lagged GEF-H1 activity at ~0–1.6 µm (left), ~1.6–3.2 µm (middle), and ~3.2–4.6 µm (right) from the edge. For each case, per-cell average cross-correlation curves (n = 5, black) are taken (red), and the cell-to-cell variability is shown by ±2 × SEM (shaded bands). The total number of windows with at least one MT depolymerization event sampled (m) is indicated. (G) Same as F with MT polymerization events occurring at 2.5 s before shrinkage.

