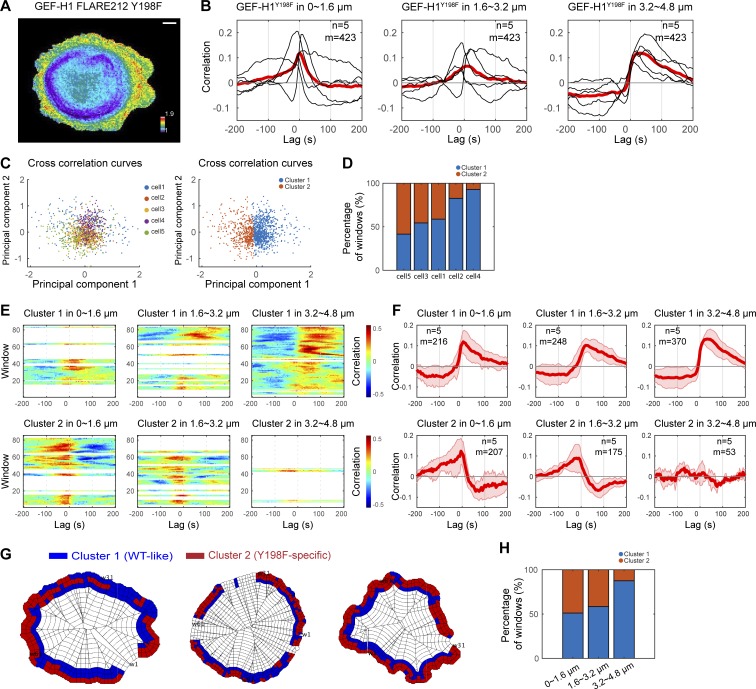
Figure 8.
Regulation by Src is critical for GEF-H1 activity at the cell edge. (A) Activity map of GEF-H1 FLARE212 Y198F in migrating MDA-MB-231 cells. Scale bar = 10 µm. (B) Cross-correlation analysis of GEF-H1 FLARE212 Y198F activity and edge dynamics at three different distances from the cell edge. Black curves represent data from individual cells, with the red curve showing the average value. The total number of windows sampled (m) in n = 5 cells is indicated. (C) A 2D projection of the cross-correlation curves of sampling windows from multiple cells using principal component analysis. Each data point represents the correlation curve of each window at −100- to 100-s lag. The correlation curves are divided into two clusters using the k-means method. (D) A bar graph showing cell-to-cell heterogeneity in the composition of the two different correlation patterns, which are the main source of heterogeneity in the correlation curves shown in B. (E) Correlation maps of edge velocity and lagged GEF-H1 FLARE212 Y198F activity split in two clusters of windows by clustering correlation curves. (F) Cross-correlation analysis of GEF-H1 FLARE212 Y198F activity and edge dynamics in the two clusters within the three different cell edge regions. The correlation pattern of cluster 1 is similar to GEF-H1 FLARE212, and the pattern for cluster 2 is specific to the Y198F mutant. Solid red curves represent averages (n = 5), and shaded confidence bands indicate ±2 × SEM. For each condition and cluster, the total number of windows sampled (m) in n = 5 cells is indicated. (G) Subcellular distribution of the windows in the two clusters at the edge of migrating MDA-MB-231 cells. (H) Composition of the two correlation patterns at different distances from the cell edge.

