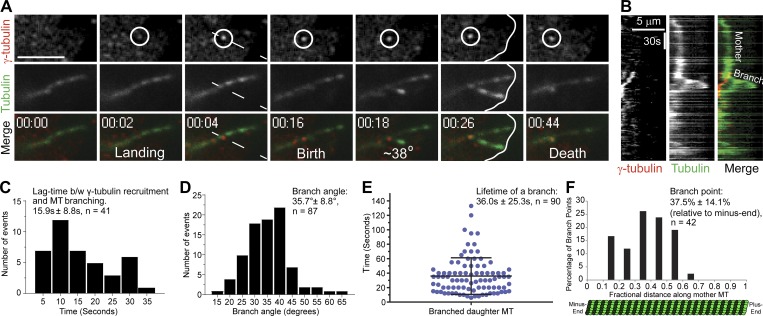
Figure 1.
Direct visualization of branching MT nucleation in Drosophila S2 cells. (A) Two-color TIRF imaging of an astral MT in a post-anaphase cell coexpressing EGFP-α-tubulin (green) and γ-tubulin-Tag-RFP-T (red). This representative branching event encompasses γ-tubulin landing on the mother MT through disassembly of the daughter MT, both of which contact the cortex (white line at 00:26). (B) Kymograph of the branching event from region (dashed line at 00:04) in A. (C) Histogram of the lag time between (b/w) γ-tubulin recruitment to the mother MT and birth of a daughter MT; n = 41. (D) Distribution of branch angles between mother and daughter MTs. The branch angles were measured 5–10 s after the appearance of daughter MTs; n = 87. (E) Dot plot shows distribution of lifetimes of daughter MTs; n = 90; lifetime is time from birth to death of the daughter MT. (F) Histogram shows distribution of branch origins along the length of mother MTs; n = 42. Time, min:s. Scale bars, 5 µm (A and B). Mean ± SD values are reported in all the histograms. Error bar on the dot plot indicates ± SD.

