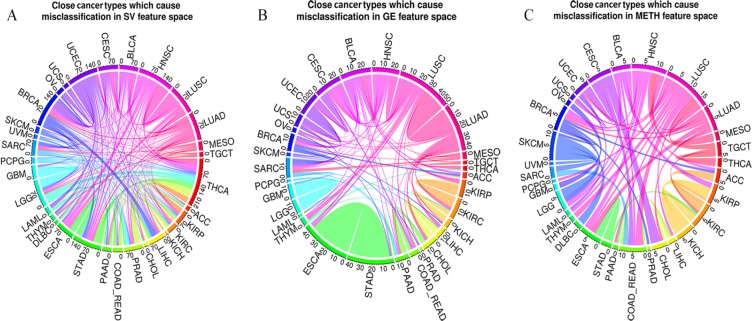
Figure 3.
Number of misclassified pairs using single omics data. The weight of the edges shows how significant is the overlap of close cancer types using (A) SV, (B) GE, and (C) METH. For example, 27 samples of STAD are misclassified as ESCA and 13 samples of ESCA are classified as STAD by using GE. As a result, the number of misclassified pairs <STAD, ESCA> using GE is 40, which is illustrated as the weight of the edge between STAD and ESCA. ESCA indicates esophageal carcinoma; GE, gene expression; METH, methylation; NPV, negative predictive value; STAD, stomach adenocarcinoma; SV, somatic variant.

