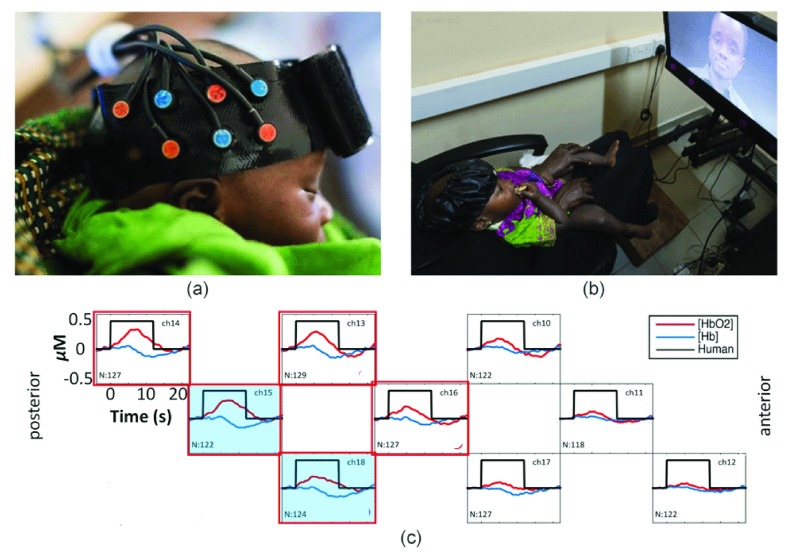
Figure 1. Set up and output of one BRIGHT fNIRS study.
( a) A sleeping infant wearing the fNIRS headband holding sources (red) and detectors (blue) in a similar set up to the data shown in the lower panel. ( b) Set up of fNIRS study in The Gambia for awake infants. Infant is seated on parent’s lap wearing the fNIRS headgear while attending to stimuli on the screen. ( c) Typical haemodynamic responses to an auditory stimulus across nine channels distributed across infants’ right temporal lobe. Responses are averaged across a group of 129 one-month-old infants (from the first wave of data collection in the BRIGHT project) showing localised increases in HbO 2 (red) and a corresponding decrease in HHb (blue) in response to auditory stimulation; red frames illustrate a significant increase of HbO 2, blue shading indicates a significant decrease in HHb. N, number of infants with valid data for each channel; ch, channel number. Image copyright: Gates Foundation ( a), Ian Farrell ( b).

