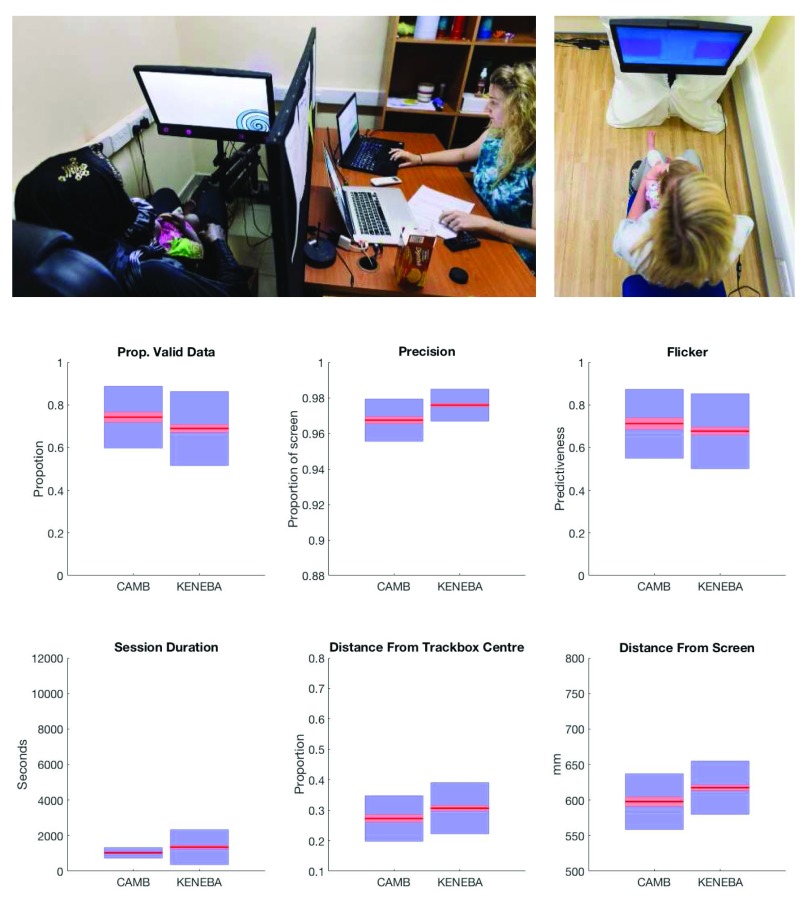
Figure 7. Set up and data quality metrics of BRIGHT ET study.
Upper panels: BRIGHT project eye tracker setup, with infant seated on parent’s lap while attending to the screen. Eye tracking is integrated in a panel just below the screen (upper left panel). Lower panels: six measures of data quality. Clockwise from top left, ( a) proportion of samples in which the eyes were detected; ( b) spatial precision; ( c) flicker, the ratio of validity for sample n to sample n+1; ( d) the duration of each eye tracking session; ( e) distance of the infant from the centre of the "track box", the volume in which the eye tracker can detect eyes (the centre of which yields optimal data quality); ( e) the distance of the infant from the screen. Red lines represent the sample mean, red boxes represent 95% confidence intervals, blue boxes represent 1 SD.

