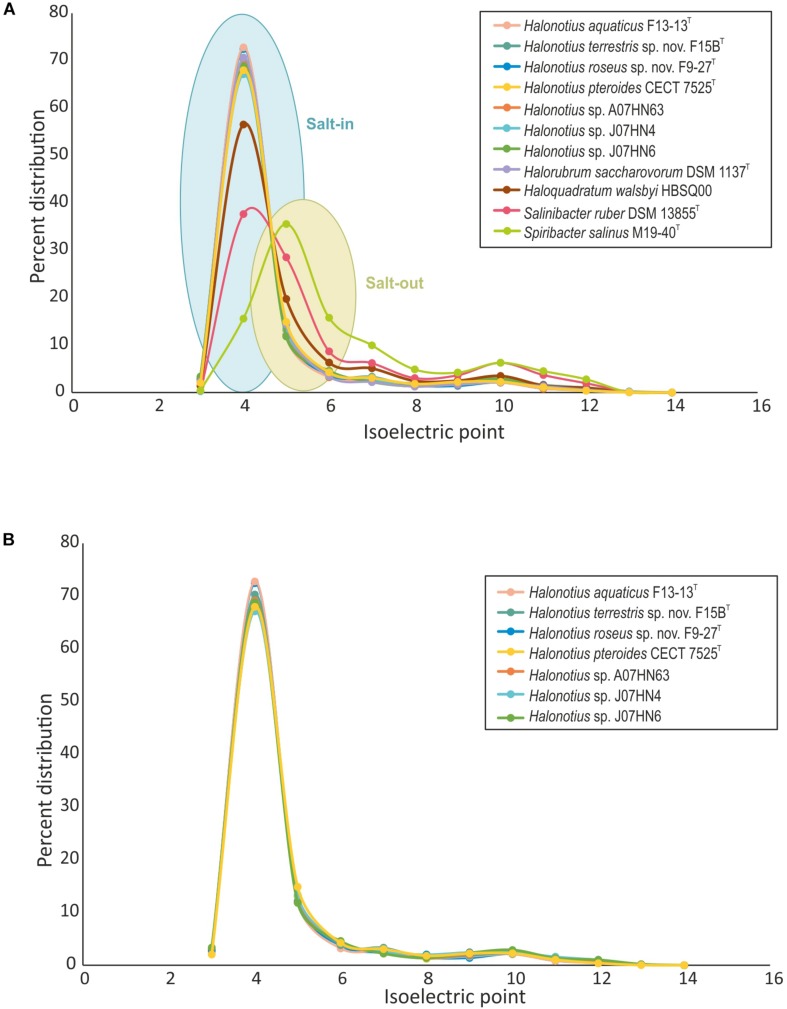
FIGURE 6.
Comparison of isoelectric profiles of Halonotius proteomes with those of other prokaryotic species. (A) Comparison of isoelectric point of predicted proteins for Halonotius and other prokaryotic species, computed for each translated genome and shown as a percentage of distribution. (B) Comparison of isoelectric point of predicted proteins between proteomes of cultured Halonotius genomes and environmental Halonotius MAGs, shown as a percentage of distribution.

