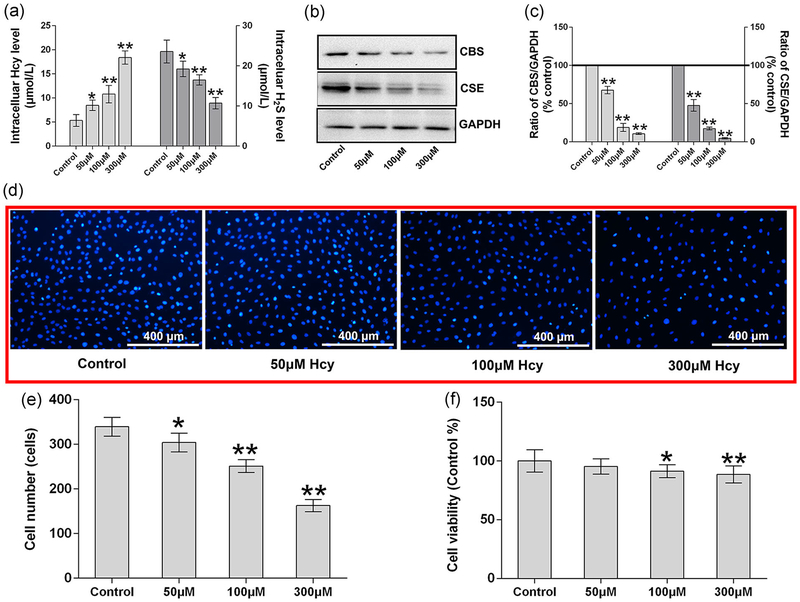
FIGURE 1.
Effect of Hcy effects on the H2S metabolism and cell viability. (a) Intracellular level of Hcy and H2S after supplemented with different dose of Hcy. (b, c) Western blot analysis of CBS and CSE expression. Quantitation of CBS and CSE by Image-Pro Plus 6.0 and displayed as relative optical density units after being standardized against GAPDH; (d) Hoechst 33342 staining of MC3T3-E1 cells; (e) quantitation of Hoechst 33342 staining and shown cell numbers; (f) cell viability analysis by MTT method. Values are means ± SD, n = 6, *p < 0.05, **p < 0.01 versus control. CBS: cystathionine β-synthase; CSE: cystathionine γ-lyase; GAPDH: glyceraldehyde 3-phosphate dehydrogenase; Hcy: homocysteine; H2S: hydrogen sulfide; MTT: thiazolyl blue tetrazolium bromide

