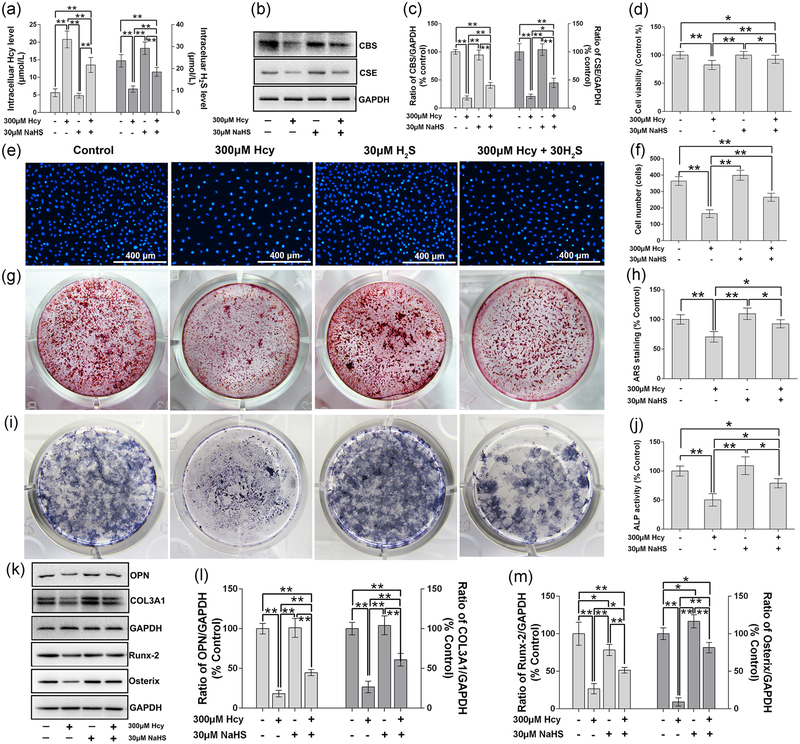
FIGURE 3.
Effect of NaHS on Hcy-induced toxic effects on cell viability and osteogenic differentiation of MC3T3-E1 cells. (a) Intracellular level of Hcy and H2S. (b) Western blot results of CBS and CSE. (c) Quantitative analyses of CBS and CSE. (d) Cell viability analysis by MTT method. (e) Hoechst 33342 staining shown cell viability. (f) Cell number analysis based on the Hoechst 33342 staining. (g) Alizarin red-S staining to show calcified nodules formation. (h) Quantative analysis of Alizarin red S. (i) Colonies formation unit of ALP (CFU-ALP) staining. (j) ALP activity assay. (k) Western blot analysis of OPN, COL3A1, Runx-2 and Osterix protein expression. (l) Quantitative analyses of OPN and COL3A1. (m) Quantitative analyses of Runx-2 and Osterix. Values are means ± SD, n = 6, *p < 0.05, **p < 0.01 between two compared group. ALP: alkaline phosphatase; CBS: cystathionine β-synthase; CSE: cystathionine γ-lyase; COL3A1: collagen type III α1 chain; GAPDH: glyceraldehyde 3-phosphate dehydrogenase; Hcy: homocysteine; H2S: hydrogen sulfide; MTT: thiazolyl blue tetrazolium bromide; NaHS: sodium hydrogen sulfide; OPN: osteopontin; Runx-2: runt-related transcription factor 2

