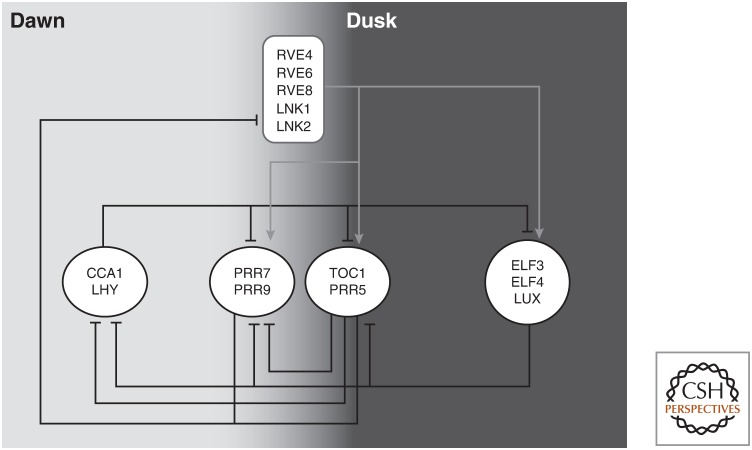
Figure 1.
A highly simplified representation of the plant circadian regulatory network. Similar genes operating at similar times during the day in a similar manner are grouped together in white circles. Black lines with blunt ends indicate genes function as repressors in the negative feedback loops. Gray lines and arrows indicate genes acting as activators in the regulatory network.

