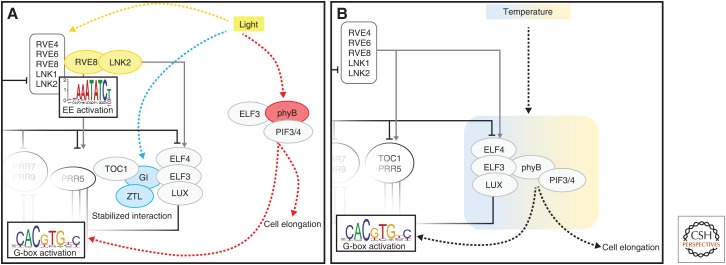
Figure 2.
Schematic representation of how light and temperature-signaling pathways integrate with the circadian clock regulatory network. The underlying clock network is the same as Figure 1 with either the light-signaling pathway (A) or the temperature-signaling pathway (B) linking to points in the circadian regulatory network. (A) Red and blue pathways indicate how these different wavelengths of light are integrated into the clock at different points via independent pathways. (B) Different temperatures influence the same pathway (blue to orange shaded box), with cooler temperatures stabilizing complex formation and warmer temperatures releasing growth factors such as PIFs.

