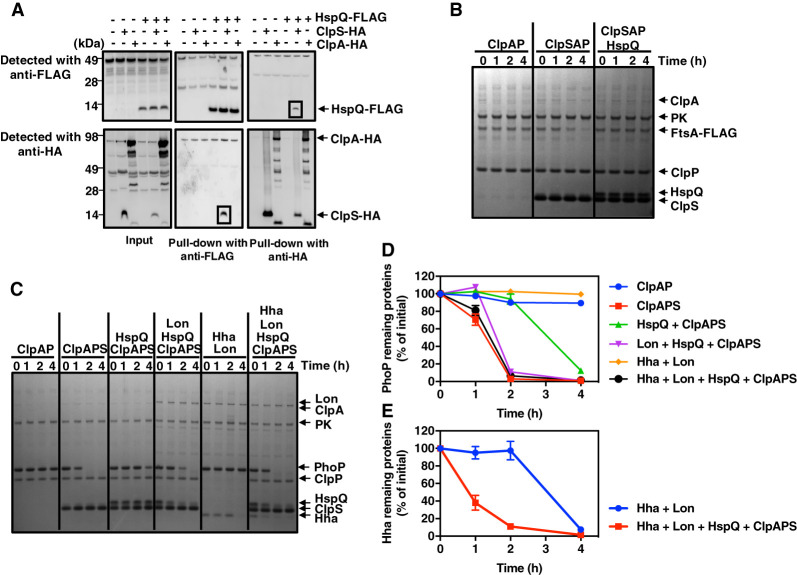
Figure 2.
The Lon-enhancing factor HspQ protein binds to ClpS, inhibiting proteolysis by ClpSAP. (A) Pull-down of lysed extracts prepared from wild-type (14028s), hspQ-Flag (JY674), clpS-HA (JY691), hspQ-Flag clpS-HA (JY692), clpA-HA (JY694), and hspQ-Flag clpA-HA (JY695) Salmonella. Squares indicate specific HspQ–ClpS interactions. Data are representative of two independent experiments, which gave similar results. (B) SDS-PAGE analysis for in vitro degradation of ClpSAP substrate FtsA-Flag. FtsA-Flag (0.2 µM) was mixed with 0.08 µM ClpA and 0.2 µM ClpP in the absence or presence of 0.08 µM ClpS or 0.5 µM HspQ. All reactions were carried out for the indicated times at 30°C in the presence of an ATP regeneration system and started by the addition of substrates. After incubation, protein amounts were determined by Coomassie-staining following separation on a 4%–12% SDS-PAGE gel. Data are representative of two independent experiments, which gave similar results. (C) SDS-PAGE analysis for time-course in vitro degradation of ClpSAP substrate PhoP. PhoP (0.5 µM), 0.5 µM Hha, and 0.5 µM HspQ were mixed with 0.08 µM ClpA, 0.2 µM ClpP, 1.0 µM ClpS, and/or 0.2 µM Lon. Reactions were carried out for the indicated times at 30°C in the presence of an ATP regeneration system and started by the addition of substrates. After incubation, protein amounts were determined by Coomassie staining following separation on a 4%–12% SDS-PAGE gel. Data are representative of two independent experiments, which gave similar results. (D) Degradation of the PhoP protein in C was determined by quantification of bands. Relative PhoP levels were calculated from two independent experiments. (E) Degradation of the His-Hha protein in C was determined by quantification of bands. Relative His-Hha amounts were calculated from two independent experiments. See also Supplemental Figures S1, S2, and S6.

