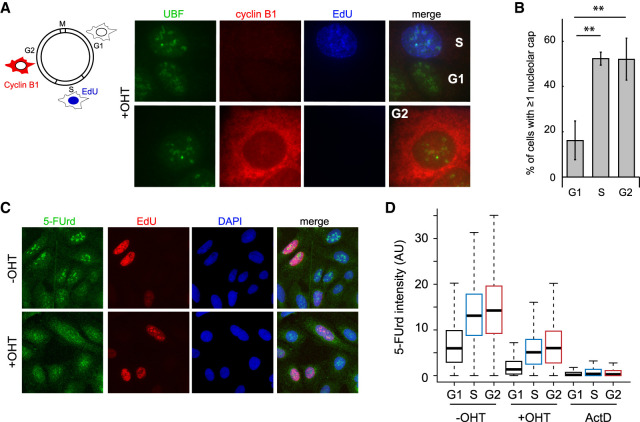
Figure 2.
Decoupling of transcription inhibition and cap formation during the cell cycle. (A, left panel) Schematic representation of the cell cycle and the methods used to visualize the G2 cells (cytoplasmic cyclin B1 staining in red), S-phase cells (nuclear EdU staining in blue), or G1 cells (absence of staining). (Right panel) Images of OHT-treated cells showing the presence of nucleolar caps (assessed by UBF staining) in EdU- or cyclin B1-positive cells. (B) The number of cells with at least one nucleolar cap in G1, S, or G2 phases as counted with UBF. The mean and SD from three independent experiments are shown. (**) P < 0.01. (C) Representative images with a 20× objective from the QIBC analysis of the 5-FUrd levels (transcription) using EdU labeling (DNA synthesis) and DAPI staining to distinguish cell cycle phases. (D) A representative box plot of the quantification of the 5-FUrd level (>1500 cells) across the cell cycle phase (G1 [black, S [blue], and G2 [red]) following OHT or actinomycin D (ActD) treatment (as indicated).

