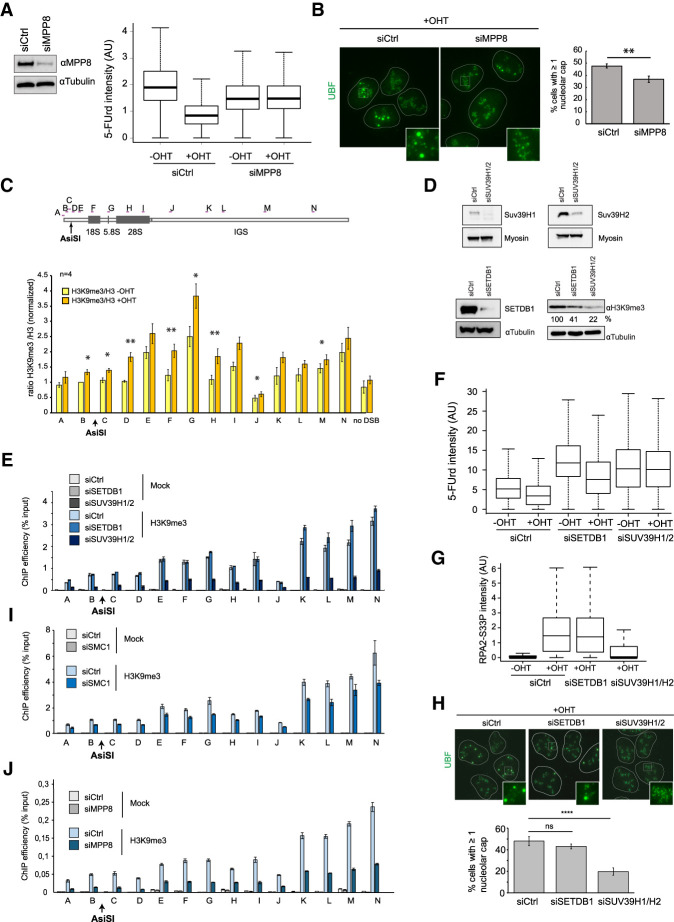
Figure 6.
The HUSH complex mediates transcriptional shutdown after DSB via H3K9me3 deposition. (A, left panel) Western blot using MPP8 and tubulin antibodies in control or MPP8 siRNA transfected DIvA cells. (Right panel) 5-FUrd level as measured by high-content microscopy (>5000 cells) in untreated or OHT-treated DIvA transfected with either control or MPP8 siRNA (as indicated). A representative experiment is shown. (B) UBF staining was performed following OHT treatment in control or MPP8-depleted cells as indicated. The left panel shows representative images, and the right panel shows the number of cells displaying at least one nucleolar cap. The mean and SD from four independent experiments are shown. (**) P < 0.01. (C) ChIP-qPCR was performed in untreated or OHT-treated DIvA cells using antibodies against H3K9me3 and H3. The mean and SEM of the ratio H3K9me3/H3 from four independent experiments are shown. (*) P < 0.05; (**) P < 0.01. (D) Western blots showing the level of SUV39H1 (top left), SUV39H2 (top right), or SETDB1 (bottom left) upon transfection of indicated siRNA as well as their influence on H3K9me3 levels (bottom right). (E) ChIP against H3K9me3 was performed in control, SETDB1, and SUV39H1/2 siRNA transfected untreated DIvA cells as indicated. ChIP efficiency (percentage of input) of a representative experiment is shown. (F) Representative box plot of 5-FUrd level as measured by high-content microscopy (>2000 cells) in untreated or OHT-treated DIvA transfected with either control, SETDB1, or SUV39H1/2 siRNA (as indicated). (G) Box plots of RPA2-S33P nucleolar intensity after depletion of SETDB1 or SUV39H1/2 followed by 4 h of OHT treatment in DIvA cells. A representative experiment is shown (>100 cells). (H) UBF staining was performed following OHT treatment in control, SETDB1-depleted, or SUV39H1/2-depleted cells as indicated. Representative images are shown (left panel), and the number of cells displaying at least one nucleolar cap was quantified (right panel). The mean and SD from four independent experiments are shown. (ns) Nonsignificant; (****) P < 0.0001. (I) ChIP against H3K9me3 was performed in control and SMC1 siRNA transfected untreated DIvA cells as indicated. ChIP efficiency (percentage of input) of a representative experiment is shown. (J) ChIP against H3K9me3 was performed in control and MPP8 siRNA transfected untreated DIvA cells as indicated. ChIP efficiency (percentage of input) of a representative experiment is shown.

