Figure 2.
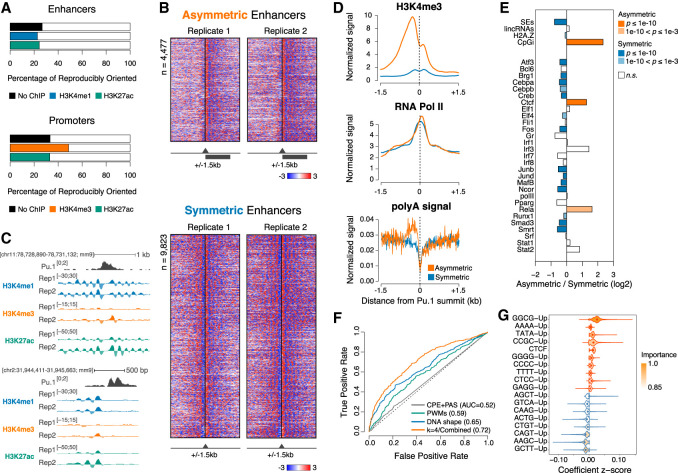
Identification of two classes of enhancers with distinct nucleosomal symmetry. (A) The percentage of reproducibly oriented elements, defined as showing concordant normalized signal bias with respect to the core element in both replicates (±500 bp), for both MNase-seq and MNase-ChIP-seq targeting the indicated modified nucleosomes. (B) Asymmetric (top) and symmetric (bottom) H3K4me1 MNase-ChIP-seq signals at enhancers centered on the summit of the PU.1 peak. Genomic regions were clustered based on signals in the central region (±500 bp). (C) Representative genomic regions showing a symmetric (top) and an asymmetric (bottom) enhancer. (D) Cumulative distributions of H3K4me3, RNA polymerase II (Pol II), and polyA signals at symmetric and asymmetric enhancers. (E) Enrichment of selected genomic features at symmetric and asymmetric enhancers. P-values are from a two-sided Fisher's exact test. (F) Receiver operating characteristic (ROC) curve and mean area under the ROC curve (AUC) values for least absolute shrinkage and selection operator (lasso) logistic regression models trained on the indicated sets of features. The ROC curve closest to the mean AUC from 100 models is shown. (CPE) Core promoter elements; (PAS) polyA signal. (G) Top-ranked features selected by bootstrap lasso for the combined model in F. Violin plots are color-coded according to coefficient signs.

