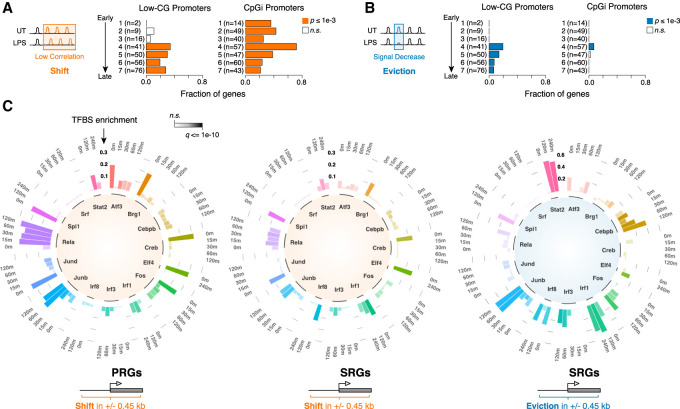
Figure 4.
Nucleosome remodeling at different classes of LPS-inducible genes. (A,B) Fraction of genes showing nucleosome shift (A) or eviction (B) at their promoter region (±450 bp), grouped by kinetics of induction upon LPS stimulation (Bhatt et al. 2012) and G+C content. H3K4me3 MNase-ChIP-seq data were used to determine nucleosome changes. (CpGi) CpG island. P-values are from a two-sided hypergeometric test. (C) Circular stacked bar plots showing TF binding enrichment at the promoters (TSS ± 450 bp) of LPS-inducible genes exhibiting remodeling events. The analysis is based on ChIP-seq data at the indicated time points of LPS stimulation. Three different groups are shown: shift at primary response genes (PRGs), shift at secondary response genes (SRGs), and evictions at SRGs. The enrichment is calculated as the difference between the fraction of remodeled sites showing binding for the indicated TF and the fraction of total sites associated with TF binding. The q-value of the enrichment is color-coded. P-values are from a two-sided χ2 test, corrected for multiple hypothesis testing using Benjamini-Hochberg.

