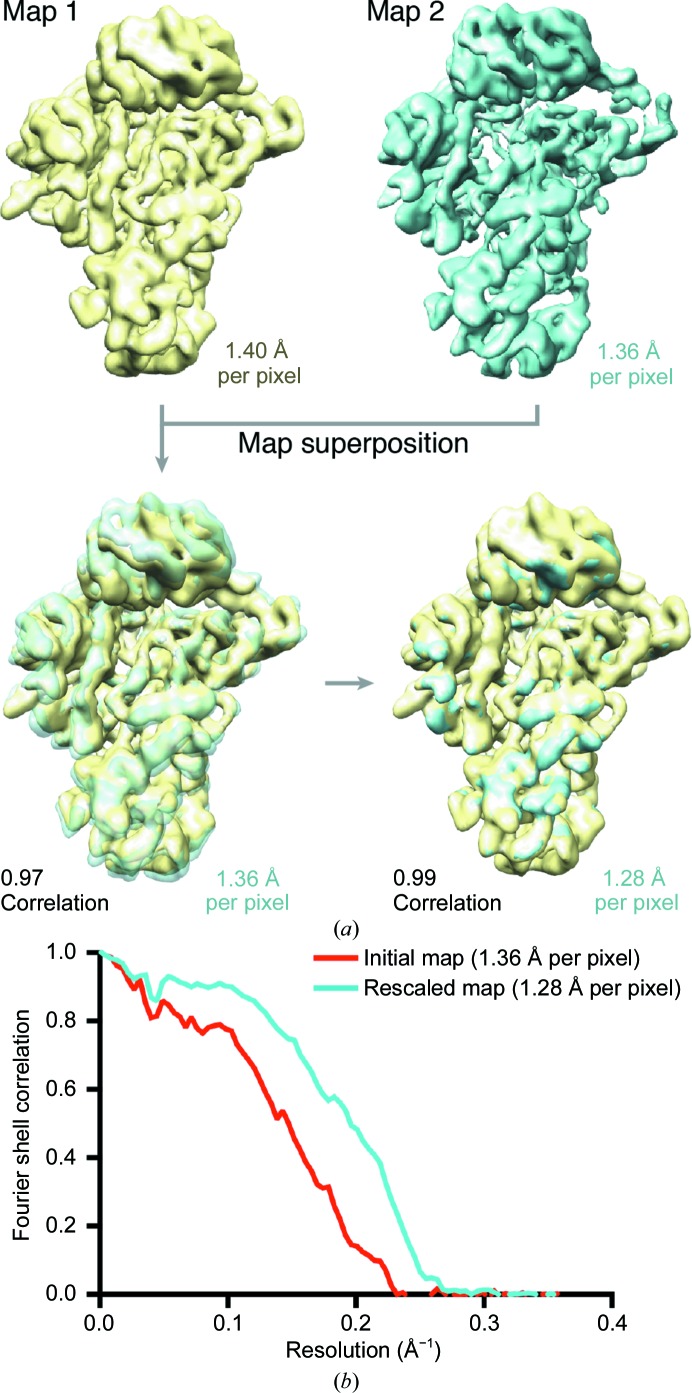
Figure 3.
Scaling factor between data sets. (a) Independent 3D maps obtained from data set I (yellow) and data set II (cyan) vary in volume size owing to differences in the nominal pixel sizes. Superposition of such maps in Chimera shows that correlation between the reconstructions improves when the pixel size of map 2 (cyan) is scaled to fit the pixel size of map 1 (yellow). (b) Fourier shell correlation (FSC) between maps 1 and 2, before and after scaling. The correlation increases at 1.28 Å per pixel.

