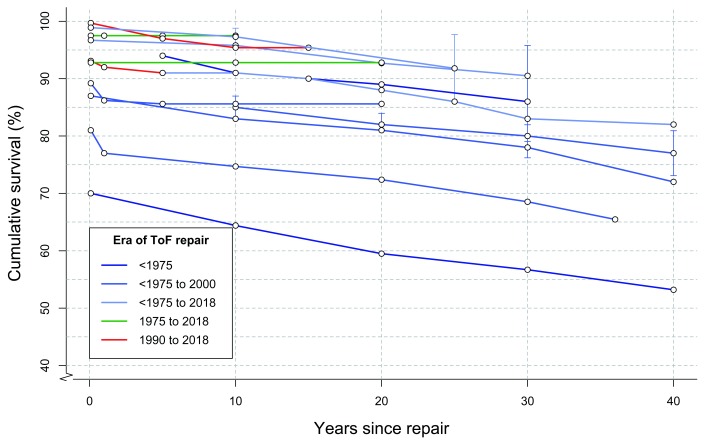
Figure 3. Survival following tetralogy of Fallot (ToF) repair.
Each colored line represents a single study, and dots represent Kaplan–Meier survival estimates at different time points 12, 53– 65. Ninety-five percent confidence intervals, where published, are shown in vertical lines. Lines are colored according to surgical era.

