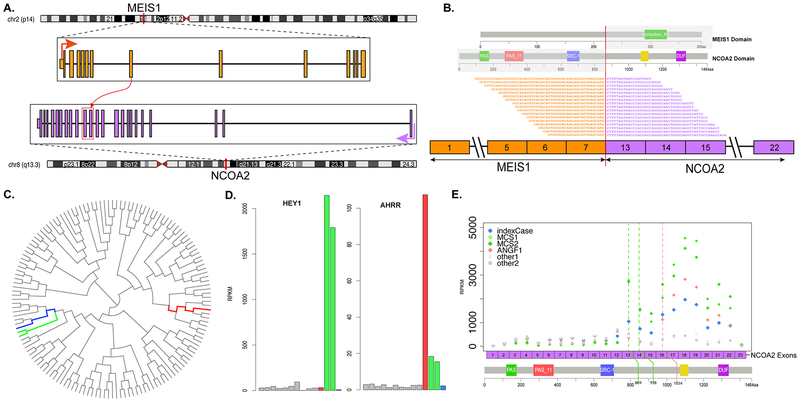
Figure 3. MEIS1-NCOA2 gene fusion structure and molecular correlates.
Diagrammatic representation of MEIS1 gene on 2p14 fused to NCOA2 gene on 8q13.3 (A). RNAseq reads identified 2 fusion transcript isoforms, in which exon 7 of MEIS1 was fused (curved red arrow) to either exon 13 or 14 of NCOA2 (red box), likely due to alternative splicing. Representative sequences from RNAseq data demonstrating the fusion of exon 7 of MEIS1 to exon 13 of NCOA2, with emphasis on which protein domains are projected to be retained in the fusion oncoprotein (B). Unsupervised hierarchical clustering of RNAseq data showing that the MEIS1-NCOA2 renal sarcoma case 1 (blue) clustered together with the 2 mesenchymal chondrosarcomas with HEY1-NCOA2 fusion (green), separate from a soft tissue angiofibroma with AHRR-NCOA2 fusion (red)(C); gray lines refer to a large cohort of various sarcoma types studied on the same targeted RNAseq platform (C). Bar chart of HEY1 and AHRR mRNA expression showing upregulation in the mesenchymal chondrosarcomas and soft tissue angiofibroma, respectively, but not in MEIS1-NCOA2 positive renal sarcoma case 1 (D). Exon level expression of NCOA2 mRNA showing up-regulation of the 3’end of NCOA2 exons retained in the fusion transcript (breakpoints of renal sarcoma index case and 2 mesenchymal chondrosarcomas were identical in exons 13 and 14, green line; while breakpoint of angiofibroma in exon 16, red line)(E).

