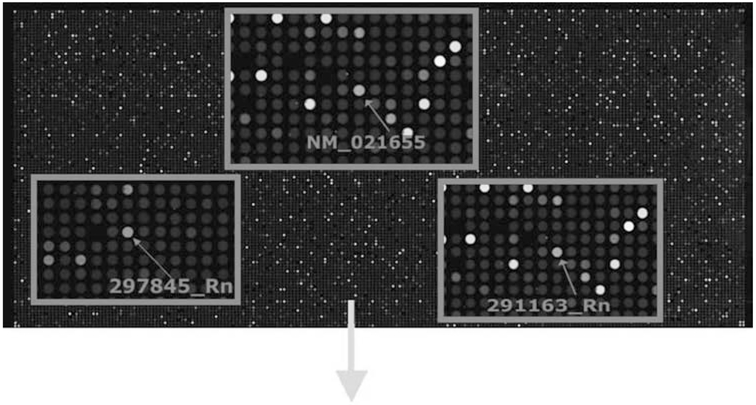
Fig. 7.
Microarray analysis of purified ECL cells. Microarray studies were done to observe genes present in the isolated population of ECL cells and to further confirm the absence of contaminating cell populations. RNA extracted from stomach mucosa was compared with RNA extracted from pure isolated ECL populations. The red dots indicate high levels of gene expression in ECL cells relative to the gastric epithelium, the green dots show low levels of expression, and yellow dots represent equal levels of gene expression when compared with that found in stomach mucosa. The gene for HDC, chromogranin A and B, and PAC1 were ≥ four fold upregulated, whereas gene expression for parietal cells, cholecystokinin A, VPAC1 and VPAC2 receptors was quite low. Gene expression for D cells and chief cells is not even listed because of the extremely low level of expression. Color image available for viewing at www.humanapress.com.

