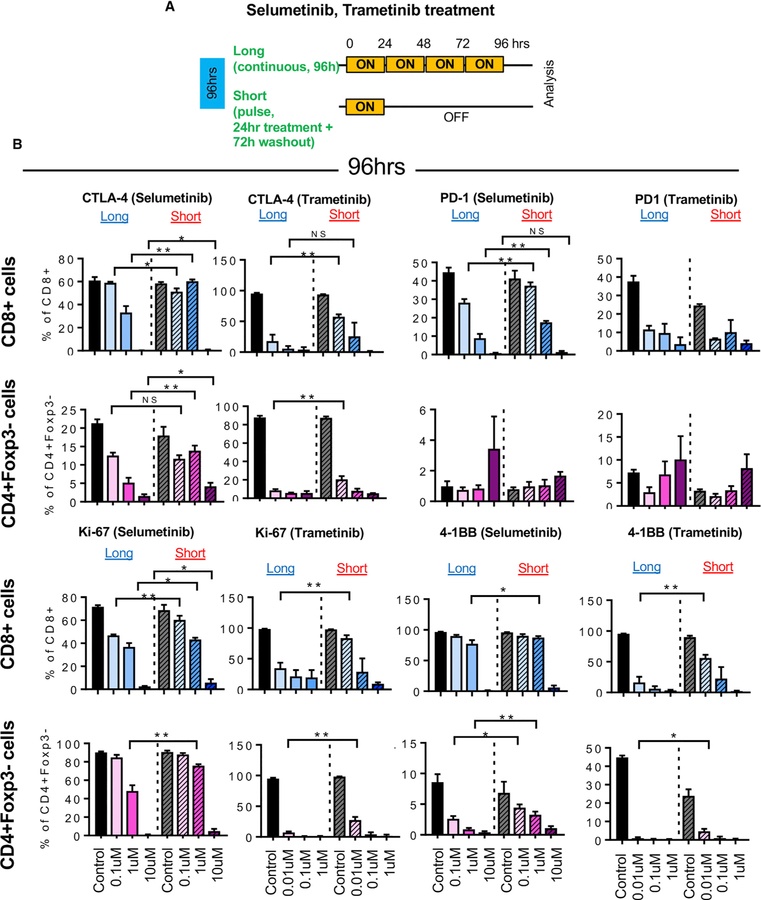
Figure 2. Short Schedule of MEKi Treatment Alters T Cell Activation Status Ex Vivo.
(A) Schema of ex vivo short versus long treatment experiment.
(B) CTLA-4, PD1, Ki-67, and 4–1BB expression in CD8+ T cells and CD4+Foxp3 cells by flow cytometry after selumetinib (left) or trametinib (right) treatment for 96 hr. *p < 0.05; **p < 0.01, Welch’s test.
Error bars represent SD. Samples were biological replicates. The experiment was performed twice, and representative results are shown here.

