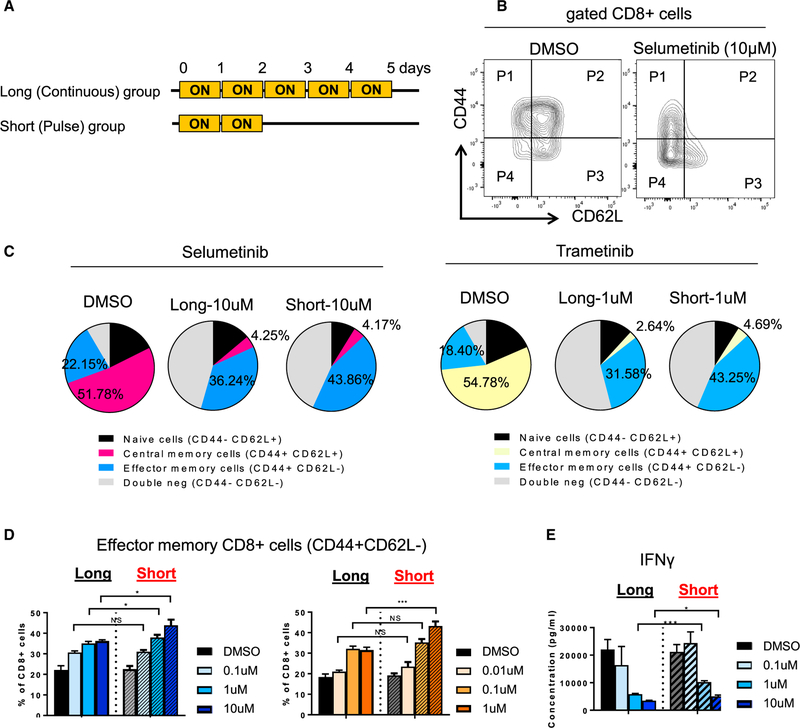
Figure 3. Short Treatment of MEKis Alters T Cell Priming Ex Vivo.
(A) Schema of short treatment on Pmel-1 CD8+ T cells with human gp100 peptide pulse.
(B) Flow cytometry plots of CD44 and CD62L markers on CD8+ T cells after 5 days of priming.
(C) Frequency of CD44 CD62L subsets from CD8+ T cells by flow cytometry analysis. Average percentage of each subset is presented.
(D) Frequency of CD44+ CD62L cell population by flow cytometry.
(E) IFNγ production from supernatant at day 5 by cytokine profiling.
*p < 0.05; **p < 0.01; ***p < 0.001, Welch’s test. Error bars represent SD. Samples were biological replicates. The experiment was performed twice, and representative results are shown here.

