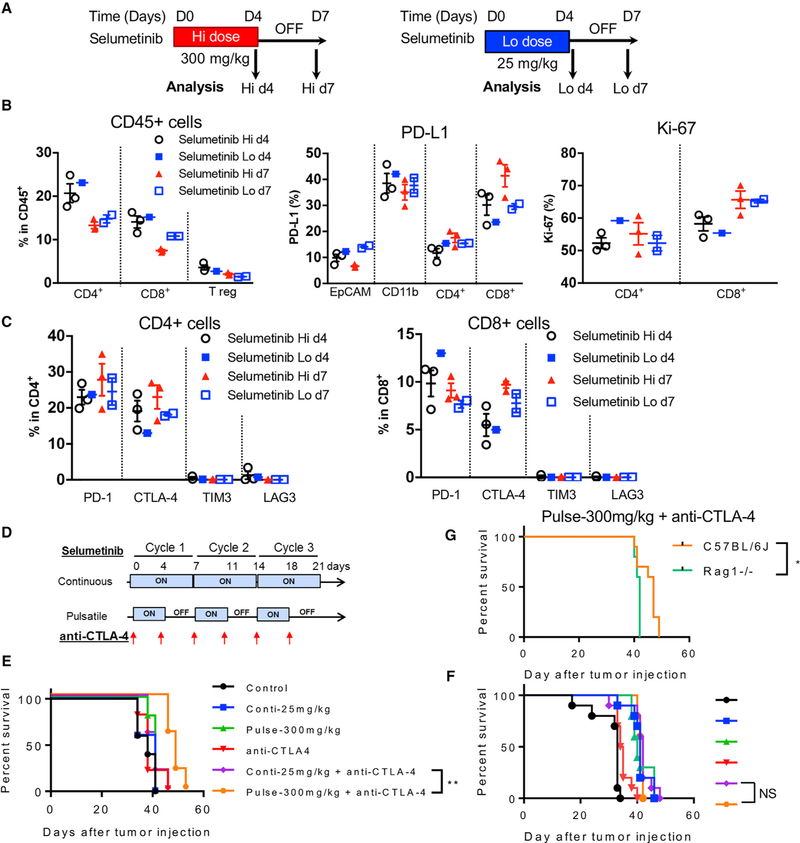
Figure 7. Pulsatile Treatment of Selumetinib with High Dosage Impacts Immune Microenvironment Differently and Enhances Survival in Combination with Anti-CTLA-4 Treatment.
(A) Schema of dosing and sample collection after either high-dose (Hi; 600 mg/kg/day; left panel) or low-dose (Lo; 50 mg/kg/day; right panel) selumetinib treatment. KrasG12DTrp53fl/fl murine transplantable tumors were treated with different dosages of selumetinib. Mouse lung tumors were collected at indicated time points. Samples were biological replicates.
(B) Flow cytometry analysis of different tumor-infiltrating T cell subpopulations within total infiltrating CD45+ leukocytes at indicated time points (left). PD-L1 expression levels on tumor cells (EpCAM+), myeloid cells (CD11b+), and T cells (CD4+ and CD8+) (middle); and Ki-67 expression (right).
(C) Quantification of inhibitory immune checkpoint molecules expressed on CD4+ (left) and CD8+ (right) T cells.
(D) Schema of selumetinib and anti-CTLA-4 treatment on LLC transplantable tumor model.
(E) Survival curve from the selumetinib and anti-CTLA-4 treatment combination in immune-competent mice (C57BL/6J).
(F) Survival curve from the selumetinib and anti-CTLA-4 treatment combination in immune-deficient mice (Rag1 / ). The color code is as same as in (F).
(G) Survival of the pulsatile selumetinib and anti-CTLA-4 treatment group.
Survival analysis was done by Log-rank (Mantel-Cox) test. * < 0.05; ** < 0.01. Samples were biological replicates. The experiment was performed 2–3 times, and representative results are shown here.

