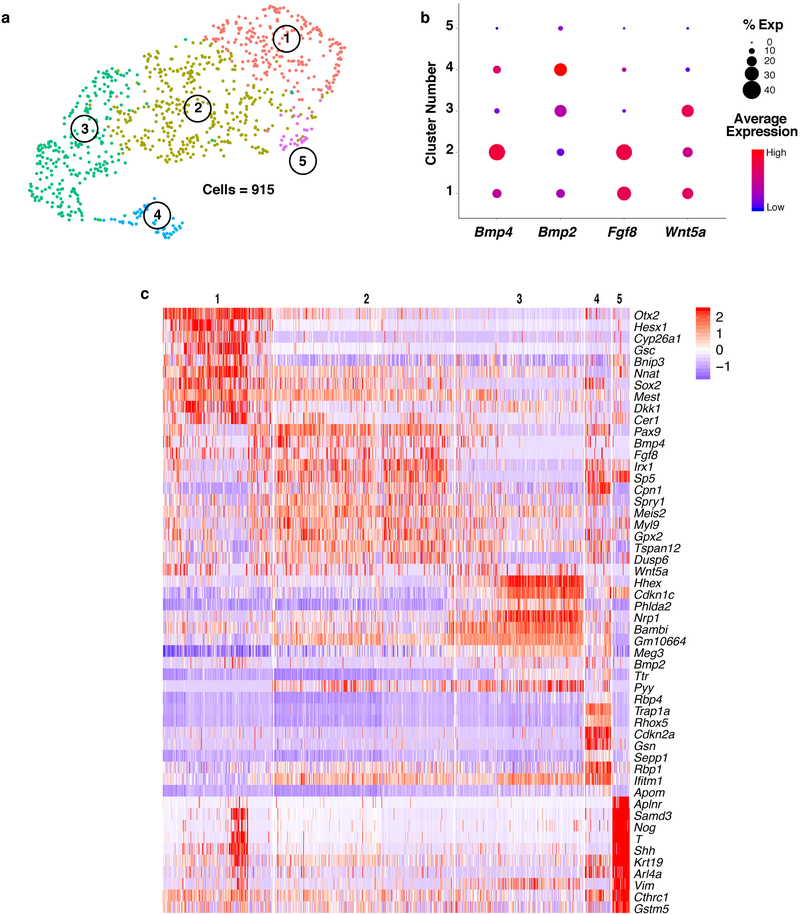
Extended Data Figure 7: Endoderm populations adjacent to the cardiac crescent.
a, UMAP plot of endoderm populations captured at E7.75 colored by cluster. b, DotPlot highlighting expression patterns of known and novel endodermal secreted factors, Fgf8, Bmp4, Bmp2, and Wnt5a. The size of the dot indicates the percentage of cells expressing that gene within a cluster (% exp), while the color encodes the average expression level of that gene within a cluster. c, Expression heatmap of the top ten marker genes of each endodermal population and secreted factors from (b). Scale indicates Z-scored expression values. Statistics for differential gene expression tests were applied to n = 915 cells.

