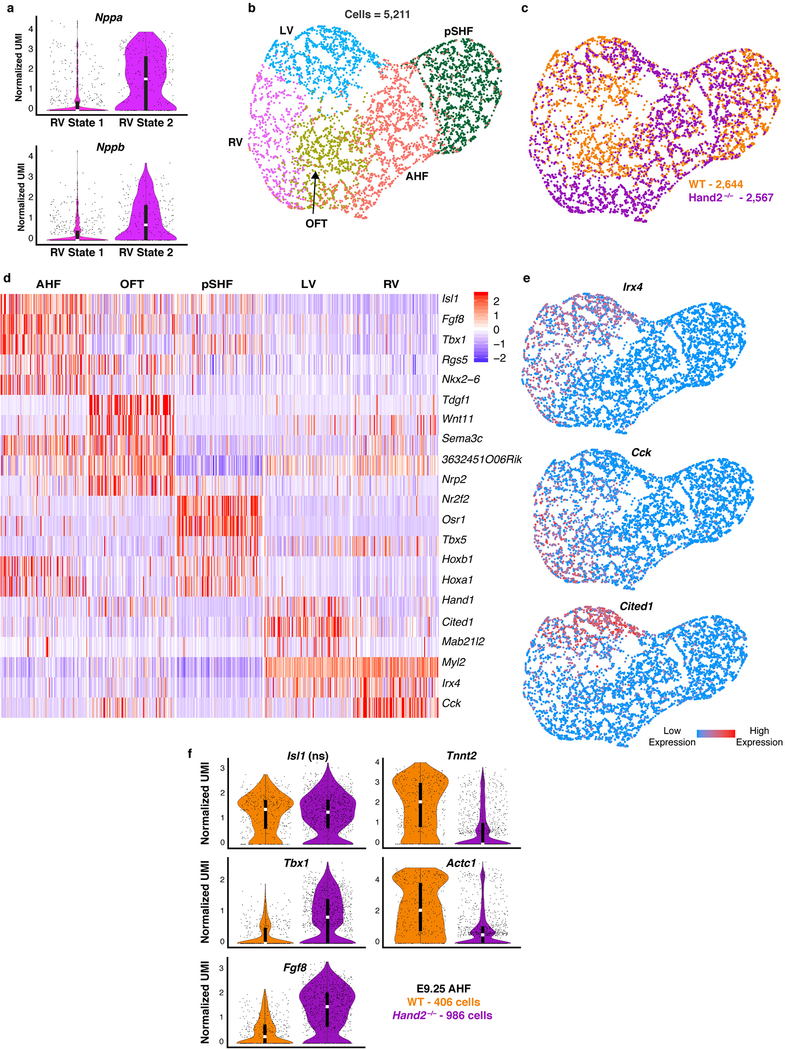
Extended Data Figure 9: Right ventricle cells are present in Hand2-null embryos at E9.25.
a, Violin plots showing expression of Nppa and Nppb in RV State 1 and 2 from Fig. 4c. Bonferroni correction adjusted p-value < 1×10⁻⁴ (Wilcoxon rank sum test, two-sided). Statistics for differential gene expression tests were applied to n = 251 cells from each State b, UMAP plot of subset of cardiac populations captured at E9.25 colored by cluster and c, genotype. d, Curated list of highly and uniquely enriched genes in cardiac populations at E9.25. Scale indicates Z-scored expression values. e, UMAP feature plot showing expression domains of Irx4, Cited1, and Cck indicating presence of LV and RV at E9.25. Statistics for differential gene expression tests for d and e were applied to n=5,211 cells. f, Violin plots of genes differentially expressed in WT vs Hand2-null AHF cells captured at E9.25. Bonferroni correction adjusted p-value < 1×10⁻⁴ (Wilcoxon rank sum test, two-sided). Isl1 is shown to indicate equivalent expression, and thus AHF identity, in WT and Hand2-null cells. ns, not significant. Violin plot summary statistics: center white line represents median gene expression and the central black rectangle spans the first quartile to the third quartile of the data distribution. The whiskers indicate value at 1.5x interquartile range above the third quartile or below the first quartile. RV, right ventricle; LV, left ventricle; OFT, outflow tract; AHF, anterior heart field; pSHF, posterior second heart field.

