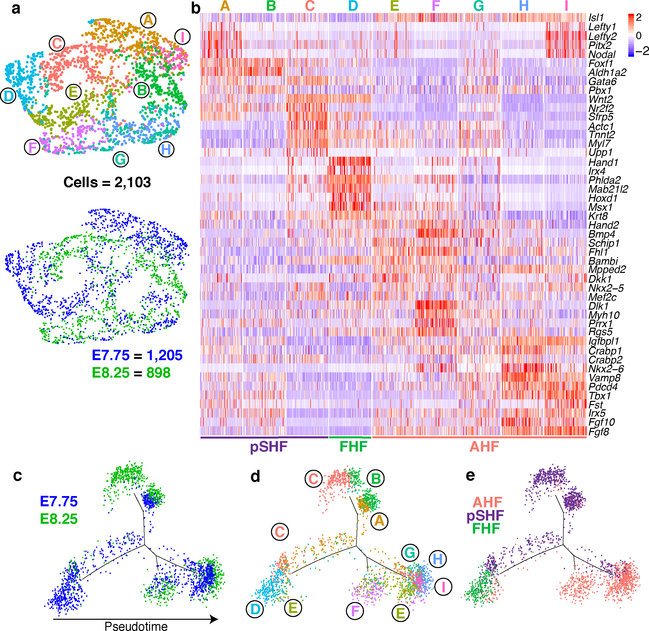
Figure 2: Analysis of cardiac progenitor cell populations reveals early specification dynamics of myocardial subtypes.
a, UMAP plot of AHF and pSHF subclusters colored by cluster identity and embryonic stage of collection. b, Expression of indicated highly and uniquely expressed genes in subpopulations from (a). Scale indicates Z-scored expression values. Pseudotime trajectory of CPCs colored by c, embryonic stage of collection, d, population identity and e, AHF, pSHF or FHF origin.

