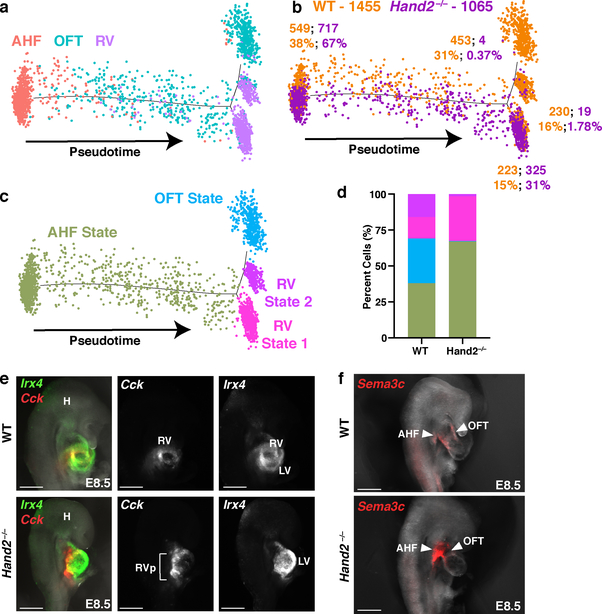
Figure 4: Hand2 loss disrupts outflow tract myocardial cell specification as well as right ventricle myocardial cell differentiation and migration.
a, Pseudotime trajectory of AHF, OFT and RV cells at E8.25 colored by cluster identity, b, genotype and c, cell state. n = 2 biologically independent embryos per genotype. Numbers in b indicate absolute number of cells of each genotype in each cell state. Percentages indicate proportions of cells per genotype in each state, graphically represented in (d). e, Expression of Cck and Irx4 by in situ hybridization in right lateral view to localize RV cells at E8.5 and corresponding fluorescence image for Cck or Irx4 expression alone. n=2 independent experiments with similar results. Scale bar, 200 μm. f, Expression of Sema3c to localize AHF cells and derivatives at E8.5 in right lateral view. n = 3 independent experiments with similar results. Scale bar, 200 μm. H, head; RV, right ventricle; RVp, right ventricle progenitors; LV, left ventricle; AHF, anterior heart field; OFT, outflow tract.

