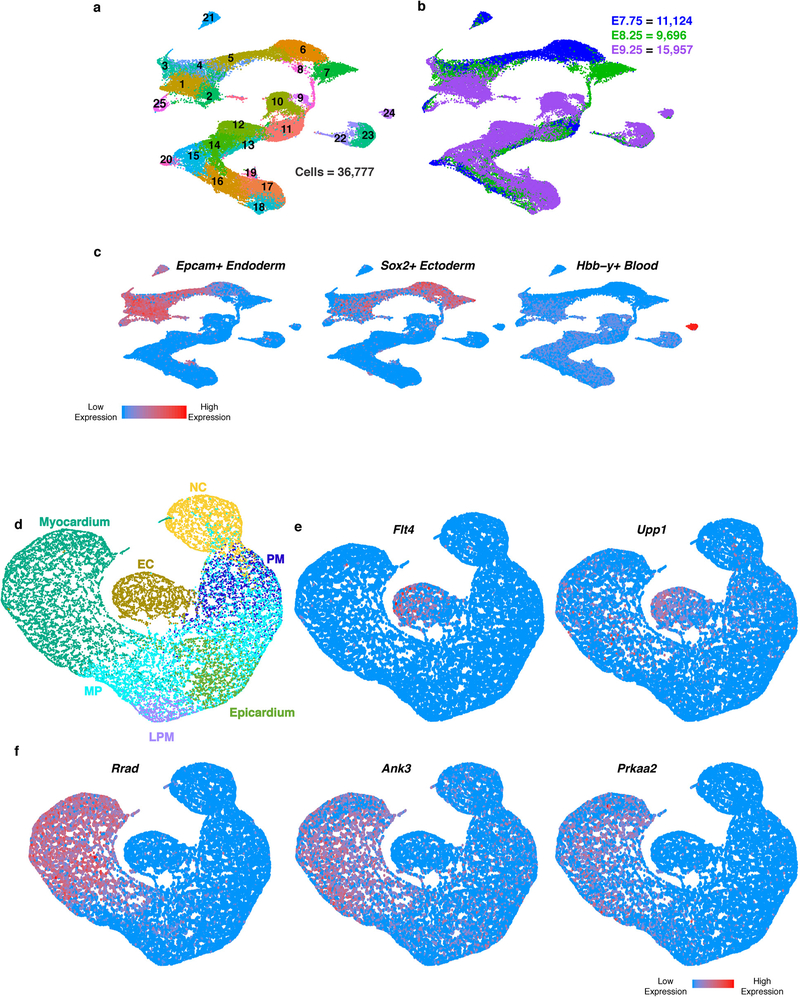
Extended Data Figure 1: Novel genes associated with CHD are enriched in specific cardiac populations.
a, UMAP plot of all captured cell populations colored by cluster and b, embryonic stage of collection. c, UMAP feature plot showing expression of marker genes used to identify and remove endoderm (Epcam), ectoderm (Sox2) and blood (Hbb-y) cell populations. Statistics for differential gene expression tests were applied to n = 36, 777 cells. d, UMAP plot of all mesodermal and neural crest populations captured at E7.75, E8.25 and E9.25 colored by cluster identity from Fig. 1d. e, Expression of Flt4 and Upp1 in Endocardium/Endothelium population. f, Expression of Rrad, Ank3 and Prkaa2 in sub-populations of the Myocardium. Statistics for differential gene expression tests were applied to n = 21,366 cells. MP, multipotent progenitors; EC, endocardium/endothelial cells; PM, paraxial mesoderm; LPM, lateral plate mesoderm.

