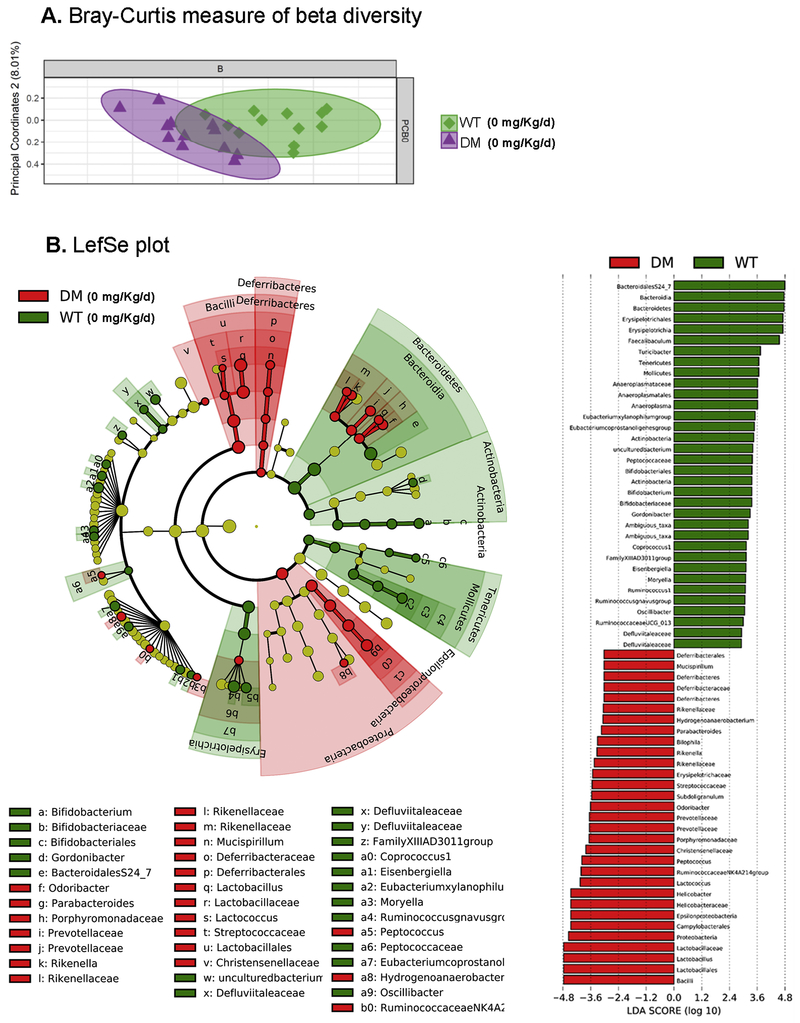
Figure 5. Differences in the gut microbiota are observed in beta diversity in DM mice following PCB exposure.
(A) Analysis for β-diversity was processed using the Bray-Curtis method with each panel representing both WT vs DM mice at 0 and 1 mg/kg/d PCB exposure. (B) Linear discriminant analysis effect size (LEfSe) was used to identify the most differentially abundant taxa between vehicle-treated WT and DM mice as represented by a cladogram (inner to outer rings: phylum, class, order, family, and genus), and their effect size (linear discriminate analysis [LDA] score plot). N = 11 mice per group.

