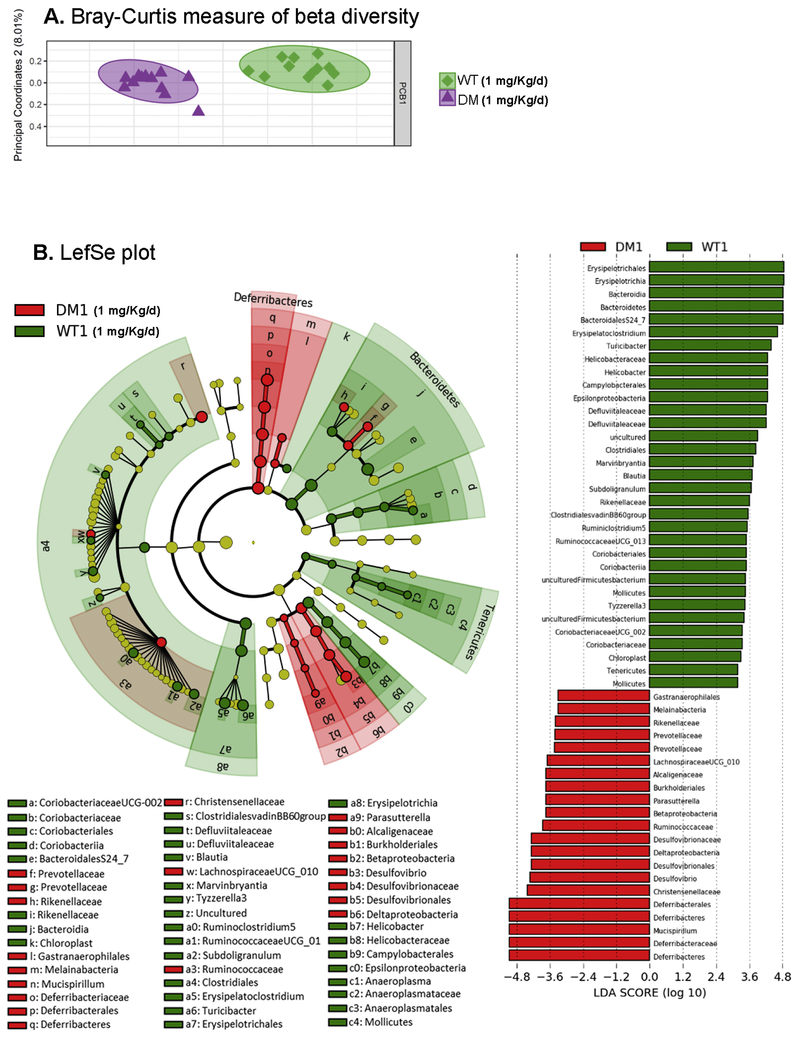
Figure 6. Differences in the gut microbiota are observed in beta diversity in DM mice following PCB exposure.
Linear discriminant analysis effect size (LEfSe) was used to identify the most differentially abundant taxa between WT and DM mice exposed developmentally to PCBs at 1 mg/kg/d, as represented by a cladogram (inner to outer rings: phylum, class, order, family, and genus), and their effect size (linear discriminate analysis [LDA] score plot). N = 11 mice per group.

