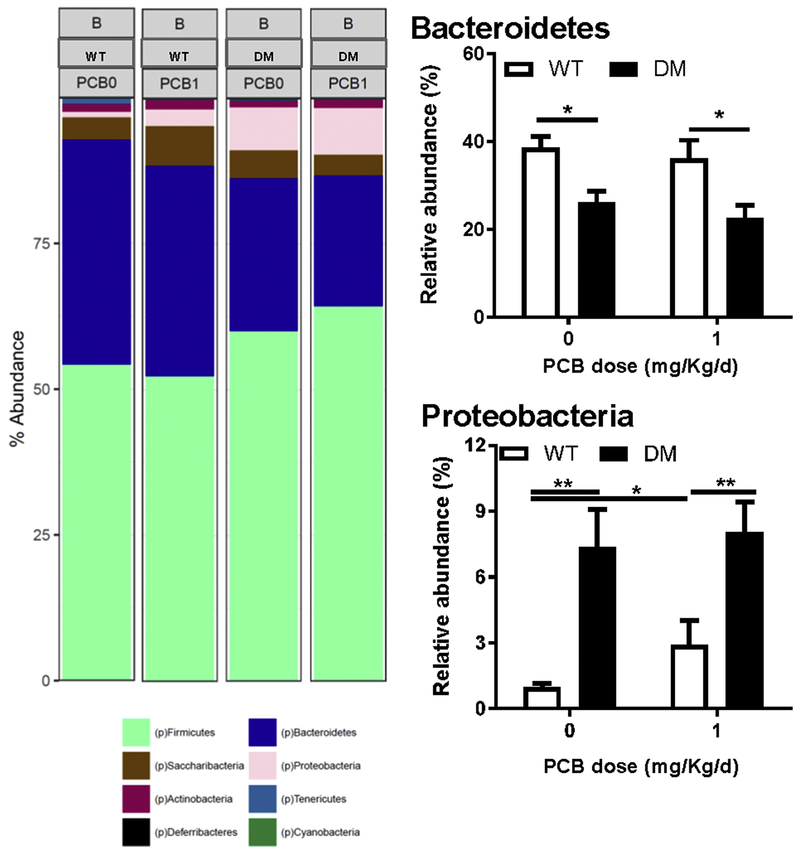
Figure 7. Differences in microbiota abundance are observed at the phylum level in DM mice following PCB exposure.
Representation of the relative abundance at the phylum level in WT vs DM mice exposed to vehicle (0 mg/kg/d) or PCBs (1 mg/kg/d). Data are presented as mean ± SEM; N = 6 mice per group. *P < 0.05; **p<0.01, 2-way ANOVA.

