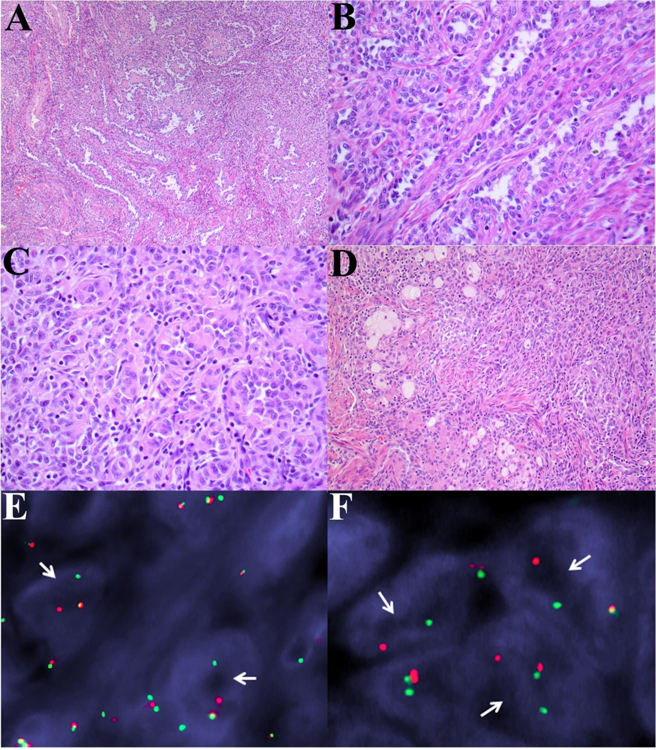
Figure 1.

ESR1-NCOA3 gene fusion in a myometrial UTROSCT (Patient 1): (A) Tumor centred in myometrium with a retiform pattern of epithelioid cells, and area of interstitial hyalinization. (B) Tubules lined by epithelioid cells with scant cytoplasm. (C) Nests of plump epithelioid cells with abundant eosinophilic cytoplasm. (D) Aggregates of cells with foamy cytoplasm. Fluorescence in situ hybridization showing break-apart signals for (E) ESR1, and (F) NCOA3 (white arrows, red, centromeric; green telomeric).
