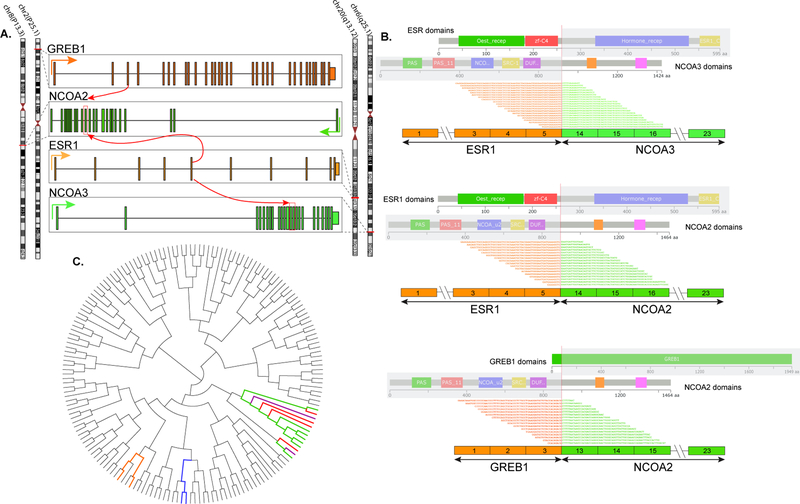
Figure 5. Fusion structures and molecular correlates.
(A) Diagrammatic representation of the 3 different fusions, including ESR1-NCOA3, resulting from a t(6;20)(q25.1;q13.12); ESR1-NCOA2, resulting from a t(8;20)(p13.3;q13.12); and GREB1-NCOA2 from a t(2;8)(p25.1;p13.3). The gene loci are indicated with red lines on the vertical chromosomes on both sides. The exonic breakpoint location is indicated by red arrows and red boxes. Green, yellow, orange arrows indicate the direction of transcription of individual gene. (B) Detailed RNA sequencing fusion junction reads, exon composition of the fusion transcripts and protein domain structures of each protein. (C) Unsupervised clustering using RNA-Seq data showing the 4 study cases (red lines) cluster closely in a tight group separate from most other sarcoma types (grey lines) available on the same platform. Interestingly, the tumors appear to cluster with low-grade endometrial stromal sarcomas containing JAZF1-SUZ12 (green) and JAZF1-PHF1 (purple) fusions genes, but not BRD8-PHF1 (orange) or high-grade endometrial stromal sarcomas with ZC3H7B-BCOR (blue) fusion products.

