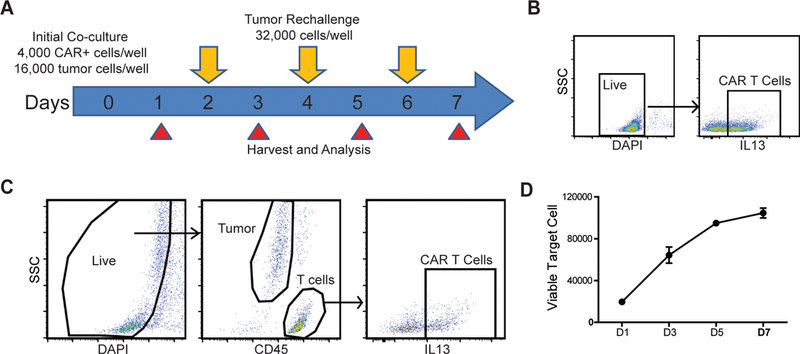
Figure 1. Schema and analysis strategy of repetitive challenge assay.

(A) Schema and timeline of repetitive tumor challenge assay. For each well, CAR T cells were first co-cultured with PBT030–2 GBM cells (4,000 CAR+ cells, 16,000 tumor cells) and re-challenged with 32,000 tumor cells every other day (D2, D4 and D6). Analysis of tumor cell and CAR T cell number, as well as CAR T cell phenotype is carried out at D1, D3, D5 and D7. (B) Gating strategy to determine CAR% in T cells before setting up the co-culture. (C) Gating strategy of live cells, tumor cells and CAR T cells from repetitive challenge assay. (D) Tumor cells number at different times of the rechallenge assay, co-cultured with untransduced T cells. Error bars: ±SEM
