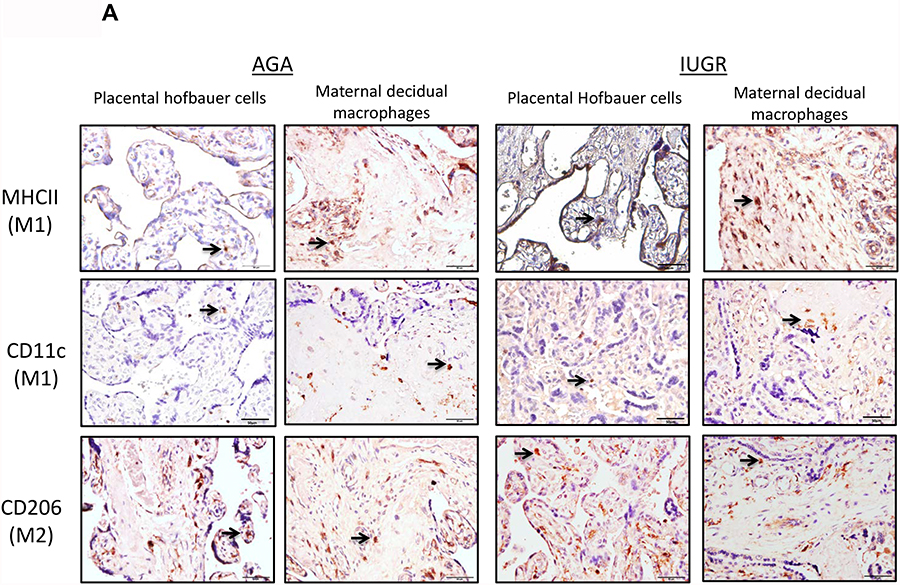
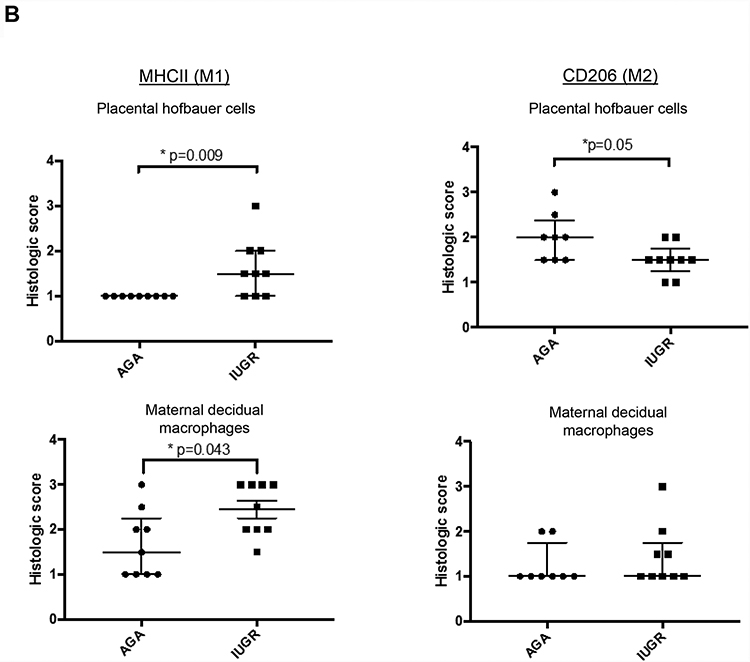
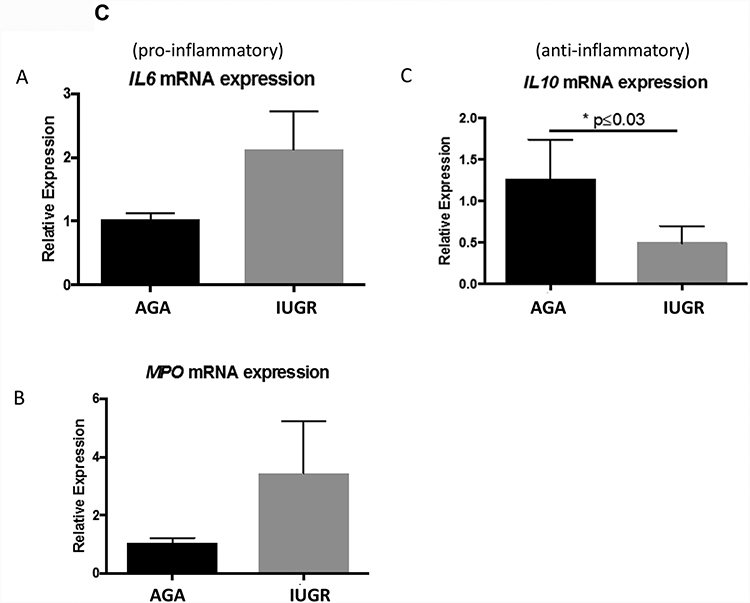
Figure 2: M1 versus M2 type polarization of macrophages in human AGA and IUGR placentas by MHCII, CD11c and CD206+ staining.
(A) Term human placentas were stained for MHCII (marker for M1-type macrophages), CD11c (M1-type macrophage marker) or CD206 (M2-type macrophage marker), and representative sections are pictured here at 200X magnification. Scale bars represent 50 μm. Black arrows indicate positively stained cells. (B) IUGR-associated placentas show enhanced MHCII staining in Hofbauer cells (AGA: median 1, interquartile range: 1–1, n=9; IUGR: 1.5, interquartile range: 1–2, n=9; p=0.009 by Mann-Whitney U testing) and in maternal decidual macrophages (AGA: median=1.5, interquartile range 1–2.25, n=9; IUGR: median=2.5, interquartile range: 2–3, n=9; p=0.043 by Mann-Whitney U testing) compared to AGA placentas. Concordantly, a reduction in M2-type marker staining (CD206) in the Hofbauer cells (AGA: median=2, interquartile range=1.5–2.375, n=8; IUGR: median=1.5, interquartile range: 1.25–1.75, n=9; p=0.05) was found, though there was no difference in the maternal decidual macrophages (p=0.56). Data are represented in scatter plots with horizontal lines representing median and interquartile range values. Asterisk indicates p<0.05 by Mann-Whitney U testing. (C) Gene expression. qRT-PCR analysis for gene expression of pro- (IL6: AGA: 1.03±0.098, n=7; IUGR: 2.12±0.61, n=5; p=0.06) (MPO: AGA: 1.037±0.18, n=3; IUGR: 3.442±1.773, n=2; p=0.17) and anti-inflammatory cytokines (IL10: AGA: 1.257±0.48, n=4; IUGR: 0.49±0.21, n=4; p=0.027) in whole placental samples. Asterisk indicates statistical significance with indicated p value, by Student’s t-test. Error bars indicate SEM values.


