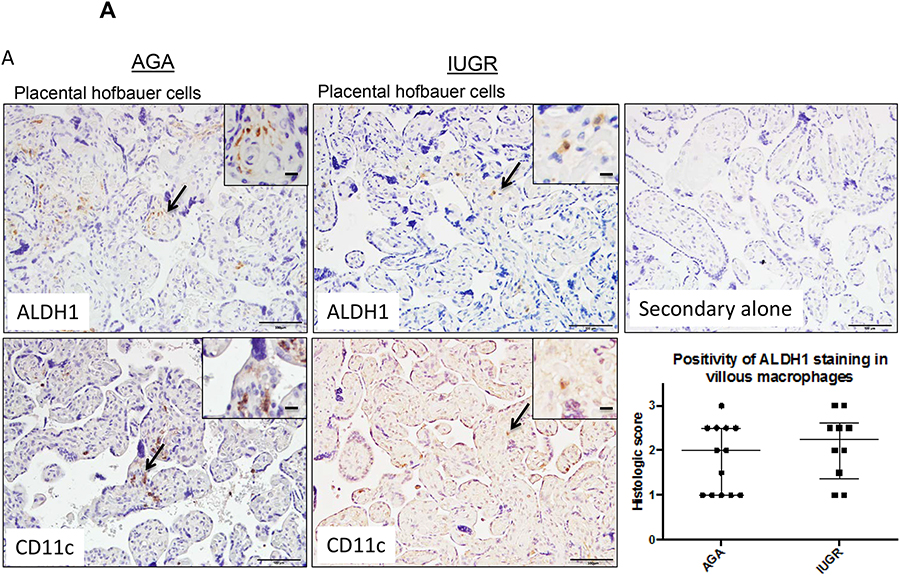
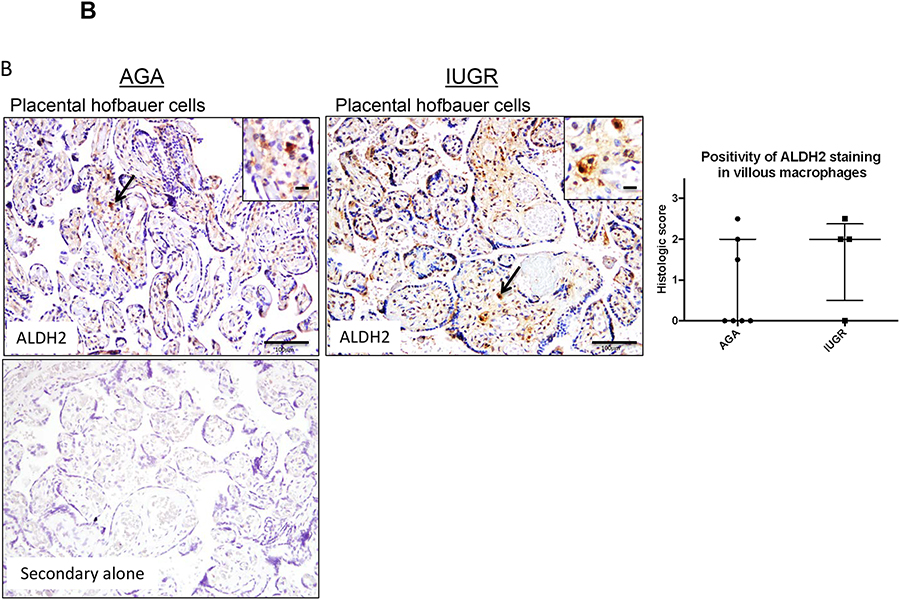
Figure 4. ALDH1 and ALDH2 are expressed in placental Hofbauer cells.
Term human placentas were stained for ALDH1 and ALDH2 expression, and representative sections of Hofbauer cells pictured here. Scale bars represent 100 μm in the top row and 50 μm in the inset panels. Arrows indicate positively stained cells (brown), with magnified insets included in the upper right hand corners for ALDH1 staining. (A) ALDH1 and (B) ALDH2 expression are both detected in placental Hofbauer cell populations, confirmed by CD11c staining in consecutive sections. (A) Positivity of ALDH1 staining by Histologic scoring in Hofbauer cells did not differ in AGA and IUGR groups (AGA: median=2, interquartile range=1–2.5, n=13; IUGR: median=2.25, interquartile range 1.375–2.625, n=10; p=0.38 by Mann-Whitney U testing. (B) Staining of Hofbauer cells with ALDH2 was twice as high in IUGR placentas compared to the AGA group (AGA: median=0, interquartile range-0–2, n=7; IUGR: median=2, interquartile range 0.5–2.375, n=4, p=0.33 by Mann-Whitney U testing). Data are represented in scatter plots with horizontal lines representing median and interquartile range values.


