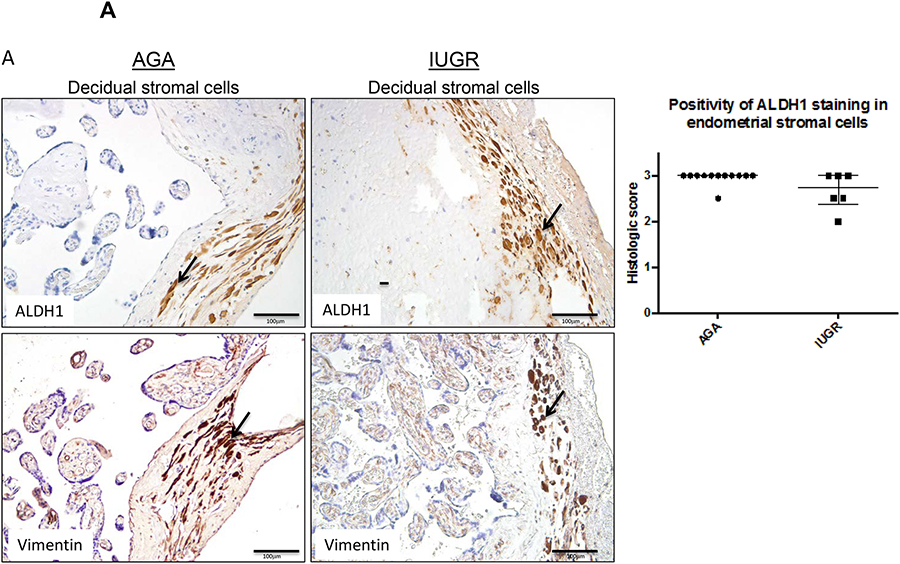
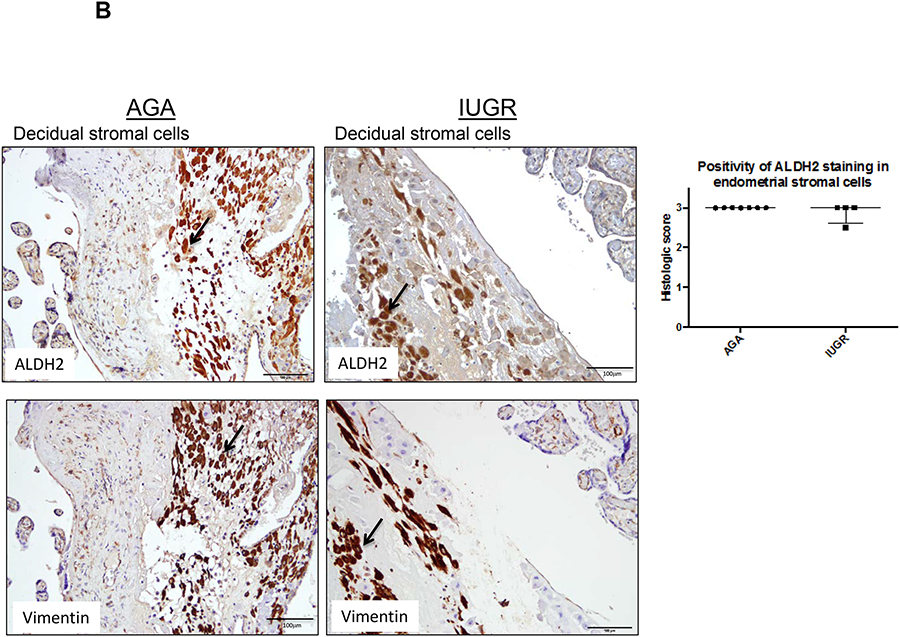
Figure 5. ALDH1 and ALDH2 expression in decidual stromal cells.
Term human placentas were stained for ALDH1 and ALDH2 expression, and representative sections of the decidual stromal cells pictured here. Vimentin staining in serial sections was used to confirm cell populations of interest. Scale bars =100 μm. Arrows indicate positively stained cells (brown). (A) ALDH1 expression trended lower in decidual stromal cells of IUGR-associated placenta compared to AGA placentas (AGA: median=3, interquartile range=3–3, n=12; IUGR: median=2.75, interquartile range: 2.375–3, n=6; p=0.06 by Mann-Whitney U testing). (B) Positivity of ALDH2 staining in decidual stromal cells was not different between groups (AGA: median=3, interquartile range 3–3, n=7; IUGR: median=3, interquartile range 2.625–3, n=4; p=0.36 by Mann-Whitney U testing). Data are represented in scatter plots with horizontal lines representing median and interquartile range values.


