Figure 1:
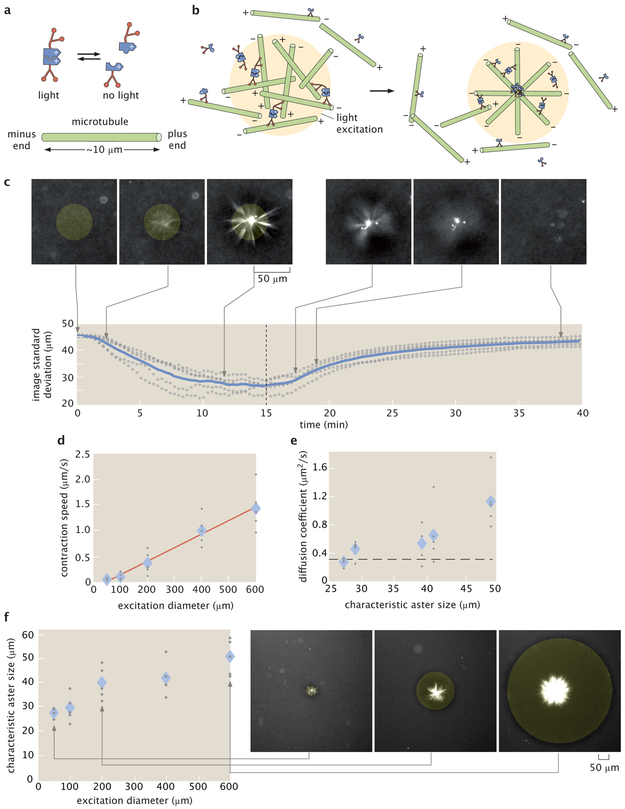
Light-switchable active matter system enables optical control over aster formation, decay and size. a, Schematic of light-dimerizable motors. b, Schematic of light-controlled reorganization of microtubules into an aster. c, Images of labeled microtubules during aster assembly and decay and corresponding image spatial standard deviation versus time. The blue line is the mean of 5 experiments and the gray dots represent individual experiments. The dashed line is when the activation light is removed, transitioning from creation to decay. d, Max contraction speed versus excitation diameter. The red line is a linear fit. e, Diffusion coefficients versus characteristic aster size. The characteristic size is the image spatial standard deviation at the 15 minute time point shown in (c). The dashed line represents the diffusion coefficient of a 7 μm microtubule (Supplementary Information 2.11). f, Aster characteristic size versus excitation diameter with representative images. In (d, e, f) the diamonds represent the mean of 5 experiments and the gray dots represent individual experiments. In (c, f), the yellow shaded disks represent the light pattern.

