
Figure 1.
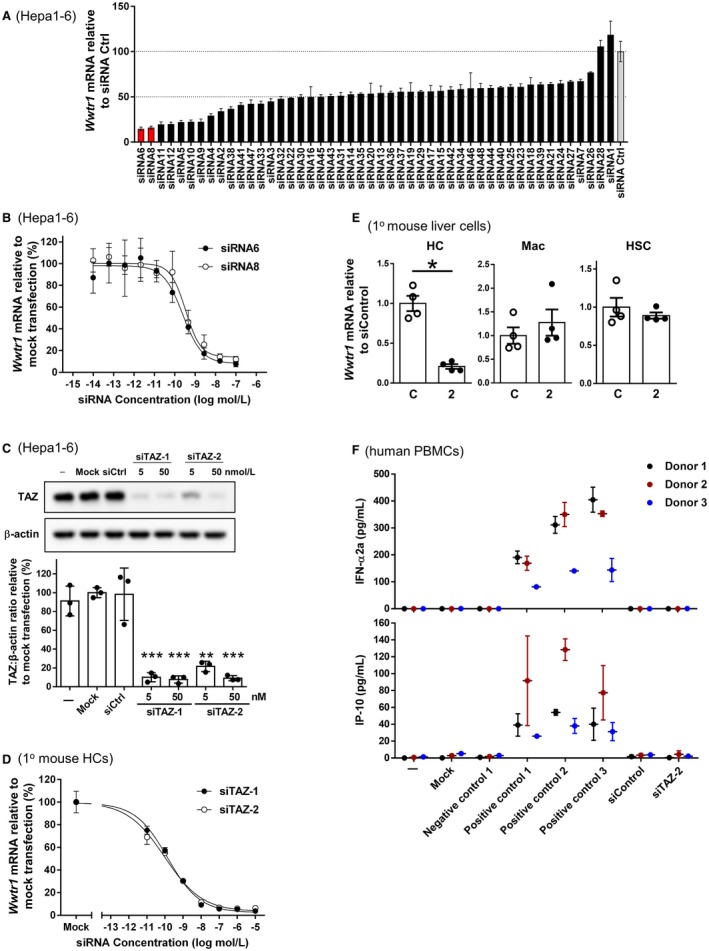
Taz siRNA screen in mouse liver cells. (A) Forty‐eight siRNAs designed against mouse Taz (Wwtr1) were transfected into mouse Hepa1‐6 cells using an siRNA concentration of 10 nM; Wwtr1 mRNA was assayed 24 hours later. Data were normalized to Gapdh, and the values in the graph are shown as percentage of Wwtr1 expression relative to the mean value of three nonspecific control siRNAs (= 100%). The average of four biological replicas ± SD is shown. (B) Dose‐response curves of siRNA6 and siRNA8; the average of four biological replicas ± SD is shown. (C) Hepa1‐6 cells were left untreated (−) or incubated under mock conditions with siCtrl or with 5 or 50 nM siTAZ‐1 or siTAZ‐2, which are the GalNAc conjugates of siRNA6 and siRNA8, respectively. Taz protein was analyzed by immunoblot and quantified by densitometry. (D) Primary mouse hepatocytes were incubated with the indicated concentrations of siTAZ‐1 and siTAZ‐2 and then assayed for Wwtr1 mRNA. The average of four biological replicas ± SD is shown. (E) Primary mouse hepatocytes, bone marrow‐derived macrophages, and HSCs were incubated with 100 nM siControl or siTAZ‐2 (shown as 2) and then assayed for Wwtr1 mRNA. The average of four biological replicas ± SEM is shown. (F) Human PBMCs were left untreated (−); incubated under mock conditions; with a negative control or three positive controls, as defined in Materials and Methods; with siCtrl; or with 100 nM siTAZ‐2. After 24 hours, IFN‐α2a and IP‐10 were assayed. Data are shown for PBMCs from three healthy donors as mean average of two to six biological replicas ± SD; *P < 0.05, **P < 0.01, ***P < 0.001. Abbreviations: C, siControl; Ctrl, control; HC, primary hepatocyte; HSC, hepatic stellate cell; Mac, bone marrow‐derived macrophage.