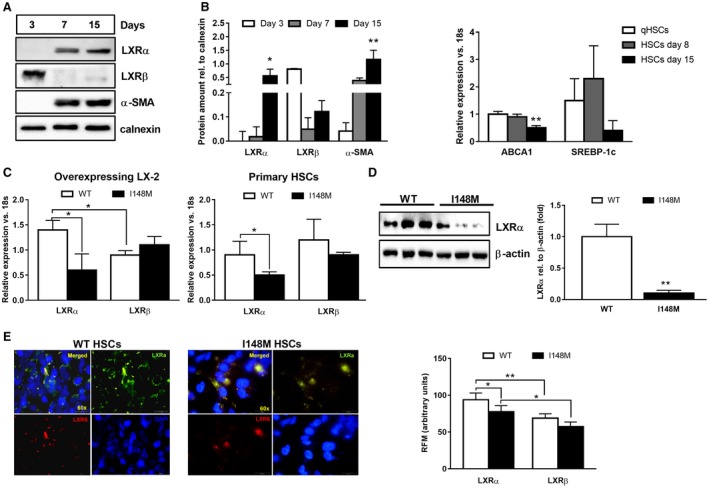
Figure 1.

Decreased LXRα transcriptional activity during human HSC activation and in PNPLA3 I148M HSCs compared to WT. Human primary HSCs isolated from liver resections and cultivated in vitro, as described in Materials and Methods. All bar graphs show mean values ± SD. (A) During in vitro activation (3, 7, and 15 days after cell isolation), cells were harvested and total protein extracts were used to detect LXRα, LXRβ, α‐SMA, and calnexin by western blotting. Blots are representative of three independent cell isolations. Densitometry analysis of blots was performed using ImageJ software, and results were normalized to calnexin. Data presented as protein amount relative to calnexin. Open bars show results for 3 days, gray bars for 7 days, and black bars for 15 days after isolation. *P < 0.05, **P < 0.01 versus day 3. (B) ABCA1 and SREBP‐1c mRNA expression analyzed by RT‐PCR and data normalized to 18s. Freshly isolated cell data are depicted in white bars, 8 days after isolation data in gray bars, and 15 days after isolation in black bars (n = 3 independent isolations). **P < 0.01 versus qHSCs. (C,D) Whole‐cell extracts isolated from primary fully activated HSCs and stably overexpressing LX‐2 (n = 3 for each PNPLA3 genotype), as indicated in the figure. Expression of both LXRα and LXRβ analyzed by RT‐PCR and western blotting. Data normalized to 18s and β‐actin for mRNA and protein, respectively. Open bars refer to PNPLA3 WT HSCs and closed bars to I148M HSCs. Representative blots displayed. *P < 0.05, **P < 0.01 versus WT HSCs. (E) Immunofluorescence staining shows intracellular localization of LXRα (Alexa 488, green) and LXRβ (Alexa 568, red) in untreated human primary HSCs (n = 3 for each PNPLA3 genotype). DAPI (blue) stains the nuclei. Merged (yellow) picture shows overlapping green and red channels. Magnification ×60, and only representative images displayed. Quantitative RFM for LXRα (green channel) and LXRβ (red channel) was calculated from representative pictures (n = 6 from each glass coverslip) using ImageJ software. Open bars refer to PNPLA3 WT HSCs and closed bars to I148M HSCs. *P < 0.05 and **P < 0.01, as indicated in the bar graph. Abbreviations: DAPI, 4′,6‐diamidino‐2‐phenylindole; qHSC, freshly isolated HSC; rel., relative; RFM, relative fluorescence mean.
